
June 2018 Unit 3 Q3
3. The diagram below shows a sketch of the graph of \(y=f(x)\). The graph passes through the points \((-2,\ 0)\), \((0,\ 8)\), \((4,\ 0)\) and has a maximum point at \((1,\ 9)\).
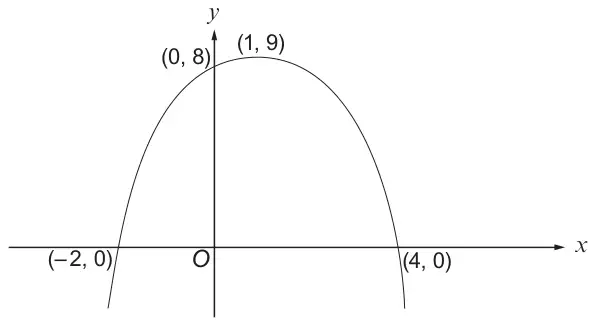
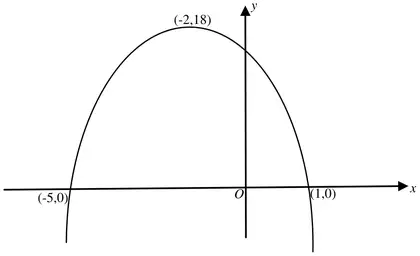
(a) Sketch the graph of \(y=2f(x+3)\). Indicate the coordinates of the stationary point and the points where the graph crosses the \(x\)-axis. [3]
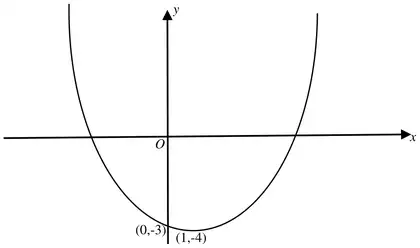
(b) Sketch the graph of \(y=5-f(x)\). Indicate the coordinates of the stationary point and the point where the graph crosses the \(y\)-axis. [3]
| Scheme | Marks | Comments |
|---|---|---|
| B1 | correct shape (hill) axes required | |
| B1 | (-2, 18) as max | |
| B1 | (-5, 0), (1, 0) | |
| [3] |
| Scheme | Marks | Comments |
|---|---|---|
| B1 | correct shape(cup) axes required | |
| B1 | (1, -4) as min | |
| B1 | (0, -3) | |
| [3] |