
June 2019 Unit 2 Q7
7. An athlete is running along a straight horizontal track during the interval \(0\leqslant t\leqslant 8\), where \(t\) is the time in seconds. The displacement, \(s\) metres, of the athlete relative to the origin \(O\) is modelled by the displacement-time graph shown below.
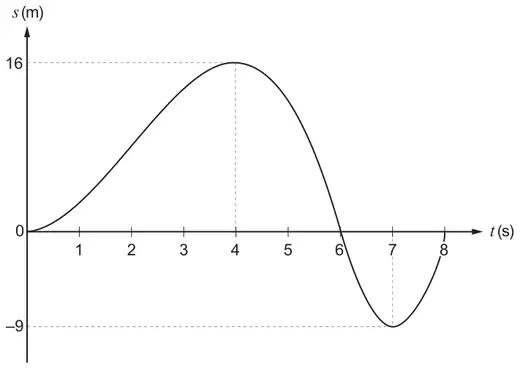
(a) Determine the total distance travelled and hence find the average speed of the athlete. [3]
(b) Write down the times when the athlete is instantaneously at rest. [1]
(c) Write down the time interval where
(i) the velocity of the athlete is negative,
(ii) the velocity is increasing and the speed is decreasing. [2]
| Scheme | Marks | Comments |
|---|---|---|
| Distance travelled \(=16+16+9+9\) \((=50\text{ m})\) | B1 | cao |
| Average speed \(=\dfrac{\text{total distance travelled}}{8}\) | M1 | Used with candidate’s distance |
| \(=\dfrac{50}{8}=6{\cdot}25\ \ (\text{ms}^{-1})\) | A1 | cao |
| [3] |
| Scheme | Marks | Comments |
|---|---|---|
| \(t=4\ \ (\text{s})\) and \(t=7\ \ (\text{s})\) \((t=0\ \ (\text{s}))\) | B1 | Both non-zero times required. |
| [1] |
| Scheme | Marks | Comments |
|---|---|---|
| (i) \(4<t<7\) oe | B1 | Statement (mathematical or otherwise) to the effect that interval is between the given boundaries. Condone equality. |
| (ii) \(6<t<7\) oe | B1 | Cao for each B1 |
| [2] | ||
| Total for Question 7 | 6 |