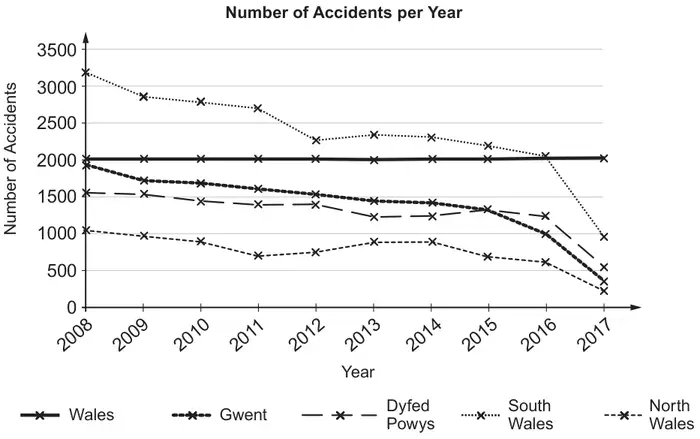
4. Angharad collects the following data from the statswales.gov.wales website which shows the number of road accidents in different regions of Wales.
Year
2008
2009
2010
2011
2012
2013
2014
2015
2016
2017
Wales
7784
7126
6850
6434
5971
5895
5876
5543
4921
2079
North Wales
1956
1724
1695
1600
1535
1445
1415
1333
997
341
Dyfed Powys
1560
1542
1454
1407
1412
1231
1249
1325
1238
543
South Wales
3208
2880
2805
2715
2283
2345
2328
2196
2066
958
Gwent
1060
980
896
712
741
874
884
689
620
237
(a) Angharad is interested in road safety and produces the following graph.
(i) State two errors that she has made.
(ii) Angharad states that South Wales is the most dangerous region of Wales in which to drive. What other information should she take into consideration before making this statement? [3]
Wales is also divided into 22 smaller regions. The numbers of accidents in 2017 in the 22 smaller regions are summarised in the table below.
Number of Accidents
Midpoint (\(x\))
Frequency (\(f\))
0 - 50
25
6
51 - 100
75·5
9
101 - 150
125·5
2
151 - 200
175·5
4
201 - 250
225·5
0
251 - 300
275·5
1
(b) For these 22 smaller regions, calculate estimates for the mean and standard deviation of the number of accidents per region in 2017. You may use \(\sum fx^2=285654\). [4]
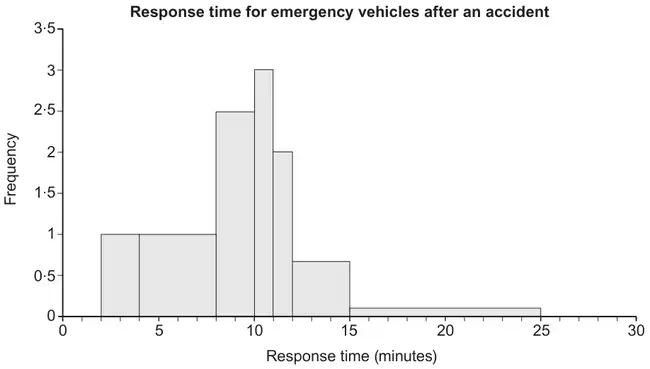
(c) Angharad also investigates the response time for emergency vehicles after 19 accidents in the region where she lives. She produces the histogram below.
(i) State a correction that Angharad needs to make to this histogram.
(ii) Angharad says, “More vehicles respond in a time between 10 and 11 minutes than in any other 1-minute interval.” Comment on her statement.
(iii) Comment on the skewness of this histogram. [3]
Mark scheme (a)
Scheme
Marks
Comments
(i) Two appropriate statements. eg. She has plotted the year / she has drawn a horizontal line for the number of accidents in Wales. She has mixed up Gwent and North Wales
B2
B1 for each valid statement.
Allow one reason per region
(ii) Valid statement. eg. The population of each region. The length of road of each region.
ft their mean provided positive term within square root for M1 and A1
Mark scheme (c)
Scheme
Marks
Comments
(i) The y-axis should be labelled frequency density.
B1
(ii) Valid comment specific to the given histogram. eg. It is not possible to tell because it is possible that all 5 response times in the 8 to 10 interval all happened between 9 and 10 minutes.
B1
(iii) Positive skew. (There is a long right-hand tail.)
We'd like to use Google Analytics cookies to count visits and see which pages help most. They're optional, and the site works exactly the same either way. Privacy policy