
June 2018 Unit 2 Q6
6. Basel is a keen learner of languages. He finds a website on which a large number of language tutors offer their services. Basel records the cost, in dollars, of a one hour lesson from a random sample of tutors. He puts the data into a computer program which gives the following summary statistics.
Cost per 1 hour lesson
Min.     :10.0
1st Qu.  :16.0
Median   :17.2
Mean     :19.8
3rd Qu.  :21.0
Max.     :40.0
(a) Showing all calculations, comment on any outliers for the cost of a one hour lesson with a language tutor. [4]
(b) Describe the skewness of the data and explain what it means in this context. [2]
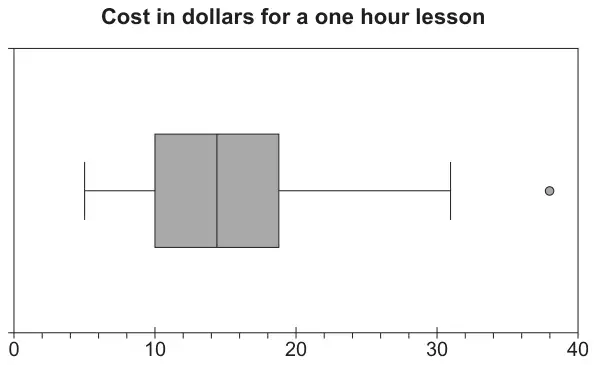
Dafydd is also a keen learner of languages. He takes his own random sample of the cost, in dollars, for a one hour lesson. He produces the following box plot.
(c)
(i) What will happen to the mean if the outlier is removed?
(ii) What will happen to the median if the outlier is removed? [2]
(d) Compare and contrast the distributions of the cost of one hour language lessons for Dafydd’s sample and Basel’s sample. [2]
| Scheme | Marks | Comments |
|---|---|---|
| \(1.5(21-16)\) \(=7.5\) | B1 | B1: 7.5 May be implied by sight of 8.5 or 28.5. |
| \(16-7.5=8.5\) (therefore no outliers below 8.5) | M1 | M1: Correct method for either using “their 7.5” |
| \(21+7.5=28.5\) (therefore outliers above 28.5) | A1 | A1: 8.5 and 28.5 both correct. |
| 40 is an outlier but there may be others. | E1 | E1: stating that 40 is an outlier but must also state or imply that the summary stats don’t show if there are any others. |
| Scheme | Marks | Comments |
|---|---|---|
| Positive skew. | B1 | Accept skewed to the right. |
| Appropriate comment. e.g. A few tutors are very expensive. The bulk of the tutors are relatively cheap. | E1 |
| Scheme | Marks | Comments |
|---|---|---|
| (i) Mean will decrease. | E1 | |
| (ii) Median may stay the same or it may decrease. | E1 | Must imply that we don’t know unless we know the individual values. |
| Scheme | Marks | Comments |
|---|---|---|
| Two appropriate comments. e.g. Dafydd’s lessons are cheaper on average than Basel’s. Dafydd’s lessons are more variable in cost than Basel’s Both are positively skewed. | E2 | E1 for one appropriate comment. E0 if omission of "on average" ISW unless contradicts a previous correct statement. Do not allow “data is more variable” without reference to cost somewhere in the answer. |
| [10] |