
Higher November 2018 Paper 2 Q15
15. Graham has recorded the time taken to score the first goal in each match for his favourite team, The Whisper Wanderers.
For a number of seasons he collected grouped data in a frequency table.
He then displayed this grouped data in a frequency diagram, as shown below.
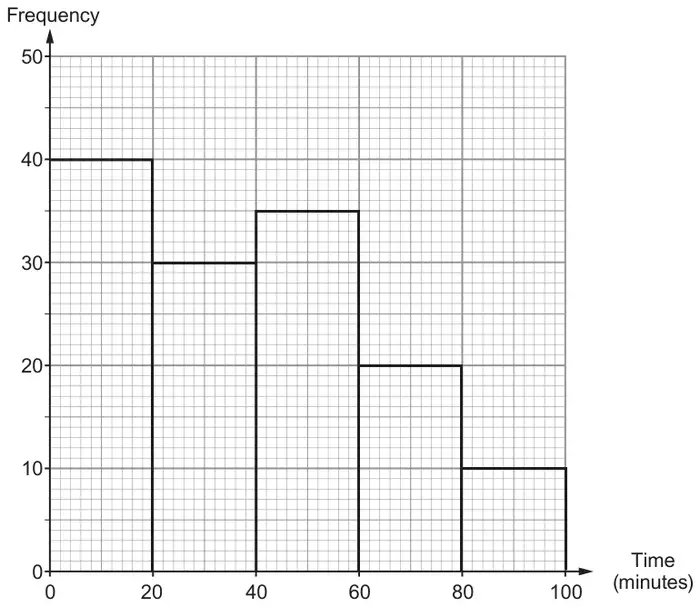
(a) How many matches are represented in the frequency diagram? [1]
(b)
(i) Calculate an estimate of the mean time taken for The Whisper Wanderers to score their first goal in these matches. [4]
(ii) How has any assumption you made in calculating your estimate of the mean time affected your answer? [1]
| Scheme | Marks | Comments |
|---|---|---|
| 135 (matches) | B1 |
| Scheme | Marks | Comments |
|---|---|---|
| (i) Midpoints 10, 30, 50, 70, 90 | B1 | |
| Sum of the products of interval points and frequencies, e.g. for midpoints use: \(10\times40 + 30\times30 + 50\times35 + 70\times20 + 90\times10\) | M1 | FT ‘their interval points’ (=5350) |
| \(\div\ 135\) | m1 | FT ‘their 135’ from (a) |
| (Use of midpoints gives) 39.6(29...minutes) | A1 | Allow 40 (minutes) from correct working Accept an answer for correct working between 29.6 and 49.63 (minutes) inclusive (Use of upper bounds gives \(6700 \div 135 =\) 49.6(29...)) (Use of lower bounds gives \(4000 \div 135 =\) 29.6(29..)) |
| (ii) Statement relevant to their assumption, e.g. if upper bounds used ‘the actual mean could be less’, if lower bounds used ‘the actual mean could be greater’, if midpoints used ‘the mean could be lower’ or ‘the mean could be higher’ or ‘the mean could be higher or lower’ | E1 | Accept ‘matches with no goals were not included so the actual mean time is greater’ |
| (6) |