
Higher June 2019 Paper 1 Q15
15. The histogram summarises the time spent by 1000 visitors at a flower show.
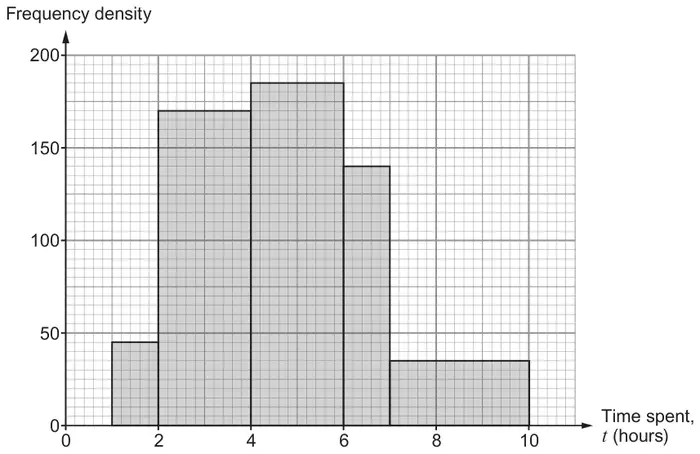
Calculate the percentage of visitors who spent 6 or more hours at the flower show. [3]
| Scheme | Marks | Comments |
|---|---|---|
| 245 CAO | B2 | B1 for \((1\times)\ 140 + 3\times35\); allow if one error in reading the values from the graph e.g. \(1\times140 + 2\times35\) or \(1\times140 + 3\times40\) |
| 24.5 (%) | B1 | FT provided at least B1 awarded. |
| (3) |