
Higher June 2018 Paper 1 Q16
16. Teddy and Ellie play computer games.
Each day they record how many hours they have spent playing computer games.
(a) Teddy keeps a record for 30 days.
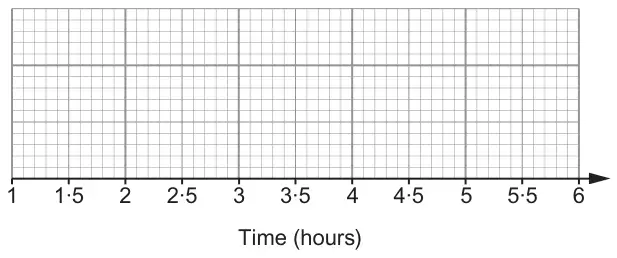
The table shows a summary of his data.
The table shows a summary of his data.
| Minimum | Maximum | Median | Upper Quartile | Interquartile range |
|---|---|---|---|---|
| 1·5 | 5 | 4 | 4·5 | 2 |
Draw a box plot to represent Teddy’s data on the grid below. [3]
(b) Here is a box plot of Ellie’s data.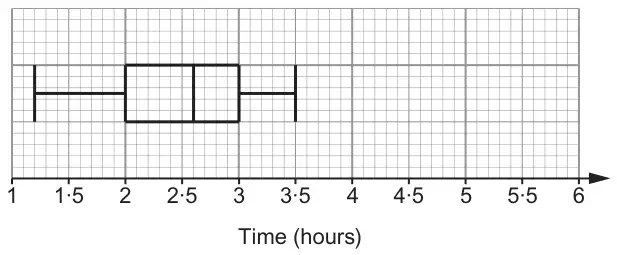
Is it possible to tell from the box plot the exact number of days for which Ellie recorded her times?
Yes ☐ No ☐
Explain how you decide. [1]
| Scheme | Marks | Comments |
|---|---|---|
| Left whisker 1.5 and right at 5 | B1 | |
| LQ 2.5 | B1 | Seen or implied |
| LQ 2.5, median 4 and UQ 4.5 in a box plot | B1 | Must be seen in a correct box plot, FT their LQ; if no LQ is stated and it is not at 2.5 allow this mark provided 1.5 < LQ < 4; |
| Scheme | Marks | Comments |
|---|---|---|
| No with valid explanation e.g. ‘Box plots do not show the individual data points.’ or ‘box plots only show summary statistics’ | E1 | Allow e.g. ‘a box plot only summarises the data’ or ‘it does not show every value recorded’ Do not allow e.g. ‘There is no data for days in the box plot’ or ‘There is no indication of the number of days Ellie took to accumulate the data.’ |
| (4) |