12. The table shows information about the length (in minutes) of phone calls made between two college friends during March.
Call length, \(c\) (minutes)
\(0 \lt c \leqslant 5\)
\(5 \lt c \leqslant 10\)
\(10 \lt c \leqslant 20\)
\(20 \lt c \leqslant 30\)
\(30 \lt c \leqslant 60\)
Frequency
3
4
7
12
6
Frequency density
(a) Complete the frequency density row in the table above. [1]
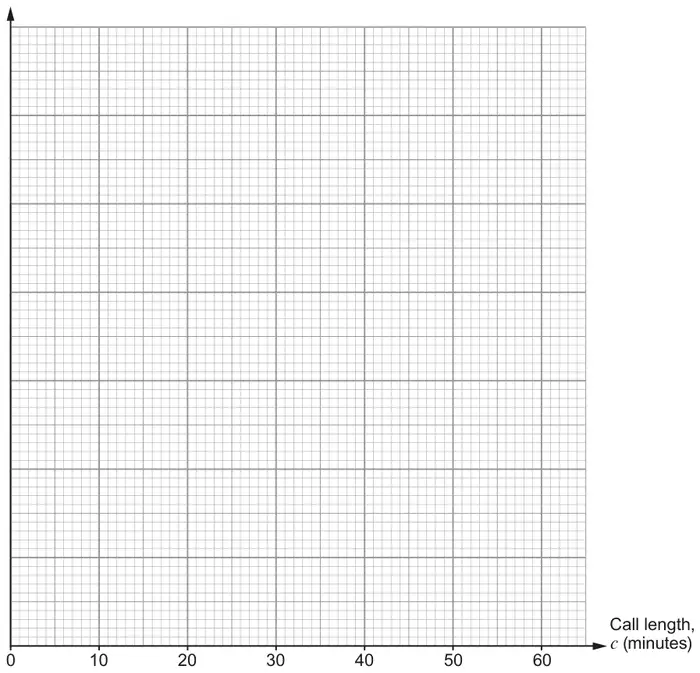
(b) Draw a histogram to illustrate the data in the table. [2]
(c) Estimate the fraction of calls that lasted for more than 35 minutes. [2]
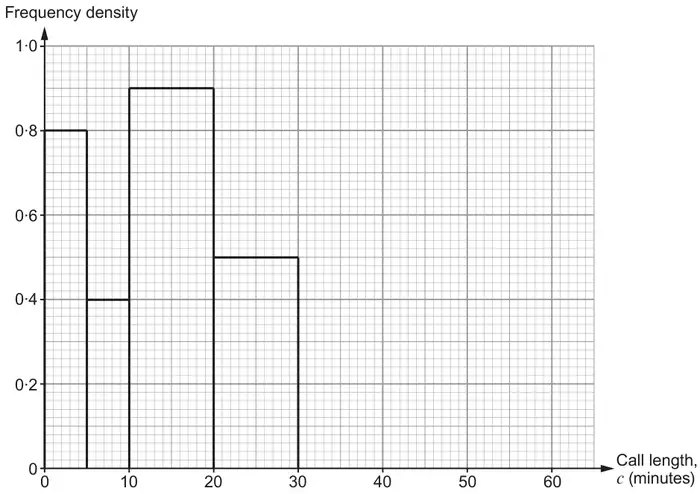
(d) This histogram shows the length of calls made between the same two college friends during April.How many phone calls were made during April? [2]
(e) During one of the months, the college friends had examinations. Compare the two histograms and explain which month this is likely to be. [1]
Mark scheme (a)
Scheme
Marks
Comments
0.6, 0.8, 0.7, 1.2, 0.2
B1
Mark scheme (b)
Scheme
Marks
Comments
Vertical axis correct and labelled; no gaps between bars
M1
FT candidate’s frequency density if table completed incorrectly but the idea of frequency density as frequency \(\div\) class width is used,
Histogram must be attempted
Fully correct histogram
A1
FT If M0 then SC1 if correct but not labelled
Mark scheme (c)
Scheme
Marks
Comments
\(\dfrac{5}{32}\)
B2
B1 for \(\dfrac{0.2 \times 25}{32}\) or \(\dfrac{1}{32}\left(\dfrac{5}{6} \times 6\right)\) or equivalent or for ‘\(\dfrac{27}{32}\) lasted for less than 35 minutes’ or equivalent or for 5 seen
Mark scheme (d)
Scheme
Marks
Comments
\(0.8 \times 5 + 0.4 \times 5 + 0.9 \times 10 + 0.5 \times 10\) seen or implied
M1
4 + 2 + 9 + 5
20
A1
Mark scheme (e)
Scheme
Marks
Comments
Selection of one of the months with a valid supporting comment. e.g. ‘April as they were too busy working to chat’ or ‘April as no time for long calls’ or ‘April as the calls were shorter’.
or ‘March as they needed time to talk about revision’ or ‘March as they needed to talk about how the exams went’.
We'd like to use Google Analytics cookies to count visits and see which pages help most. They're optional, and the site works exactly the same either way. Privacy policy