13. The same home learning task was given to 50 Year 7 pupils in school A and 50 Year 7 pupils in school B. The length of time, in minutes, each pupil took to complete the task was recorded.
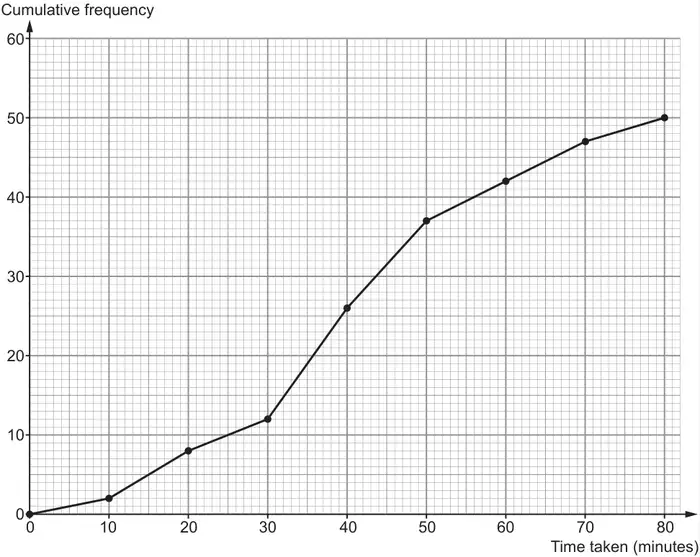
(a) The results for the pupils from school A are shown on the cumulative frequency diagram below.
Use the cumulative frequency diagram to answer the following questions about the pupils in school A.
(i) What is the median time taken to complete the task? [1]
(ii) Calculate the inter-quartile range of the times taken to complete the task. [2]
(iii) What percentage of pupils took longer than 62 minutes to complete the home learning task? [2]
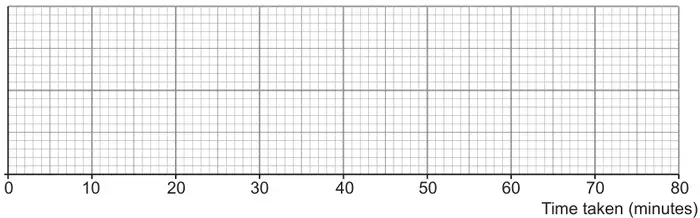
(b) A summary of the results for the pupils in school B is shown in the table below.
Least time
12 minutes
Lower quartile
31 minutes
Median
45 minutes
Inter-quartile range
24 minutes
Greatest time
1 hour 5 minutes
Draw a box plot to display the results for school B. [3]
(c) Make two comments to compare the results of school A and school B. One comment must include an appropriate average. The other comment must include a measure of spread. [2]
Mark scheme (a)
Scheme
Marks
Comments
(a)(i) A value between 39 and 40 (mins) inclusive
B1
(a)(ii) Intention UQ – LQ using readings for 37.5 and 12.5 (pupils) 50 to 51 (minutes) and 30 to 31 (minutes)
M1
Answers in the range 19 to 21 (minutes) inclusive.
A1
If no marks and a median of 43 to 44 seen in (a) award SC2 answers of 33 to 34 (from LQ and UQ at frequencies of 15 and 45 respectively)
(a)(iii) \(\frac{7}{50}\ (\times 100)\)
M1
= 14 (%)
A1
If no marks, award SC1 for an answer of 86 (%) If use of 60 as total frequency already penalised award SC2 for an answer of 28(.33…%) or SC1 for \(\frac{17}{60}\ (\times 100)\) or an answer of 71.66.. or 72%
Mark scheme (b)
Scheme
Marks
Comments
Left whisker at 12 and right at 65
B1
UQ 55
B1
Seen or implied.
UQ 55, median 45 and LQ 31 in a box plot
B1
Must be seen in a correct box plot, FT their UQ; if no UQ is stated and it is not at 55 allow this mark provided 45 < UQ < 65.
Mark scheme (c)
Scheme
Marks
Comments
Valid comment comparing medians e.g.
‘On average, School A were quicker than School B as the median was 39.5 in school A and 45 in School B.’ ‘On average, School B were slower than School A as the median was 39.5 in school A and 45 in School B.’
E1
FT their median and IQR from (a)
Must be a comparison not simply a comment about one school.
Allow e.g. ‘School A had a lower median (so were quicker on average)’. ’The average of School A is 5.5 minutes faster’. ‘School A had a lower average of 39.5’ as clearly using the median as the average.
Do not allow e.g. ‘School A had a median of 39.5 and School B had a median of 45’ (no comparison). ‘On average School A were quicker’, (no reference to median or comparison of values).
Valid comment comparing IQRs or range e.g.
‘School A’s results were less varied than School B’s as the IQR was 20 which was less than School B’s (which was 24)’ ‘School A’s results were more consistent than School B’s as the IQR was 20 which was less than School B’s (which was 24)’ ‘School A’s results were more varied than School B’s as the range is bigger than School B’s (which was 53)’
E1
FT “their IQR’ from (a)(ii) Must be a comparison not simply a comment about one school.
Allow e.g. ‘School A’s marks were more consistent as the IQR is smaller’.
Do not allow e.g. ‘School A had an IQR of 20 and School B had an IQR of 24’ (no comparison). ‘School B’s results are more spread out than School A’s’ (need to mention IQR since range for School A is greater)
We'd like to use Google Analytics cookies to count visits and see which pages help most. They're optional, and the site works exactly the same either way. Privacy policy