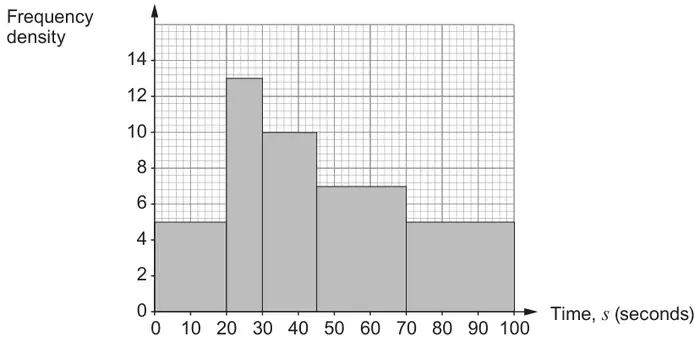
(a) Freya records how long each of 40 people can hold their breath. The results are shown in the table.
Time, \(s\) (seconds)
Frequency
\(0\lt s\leqslant20\)
5
\(20\lt s\leqslant30\)
13
\(30\lt s\leqslant45\)
10
\(45\lt s\leqslant70\)
7
\(70\lt s\leqslant100\)
5
Freya wants to draw a histogram for this data. This is the graph she draws.
Has Freya drawn a histogram?
Yes ☐ No ☐
Give a reason for your answer. [1]
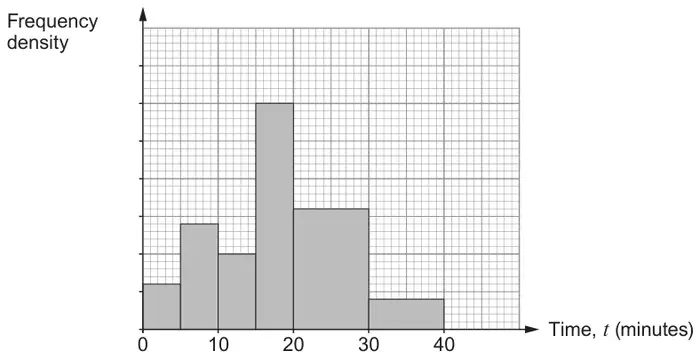
(b) In one month, 2000 patients visited a doctors’ surgery. This histogram shows information about the length of time, \(t\) minutes, these 2000 patients spent at the surgery.
The group \(0\lt t\leqslant5\) represents 120 patients.
How many patients are represented by the group \(30\lt t\leqslant40\)? [2]
Mark scheme (a)
Scheme
Marks
Comments
No with valid explanation e.g. ‘she has plotted frequency, not frequency density’
We'd like to use Google Analytics cookies to count visits and see which pages help most. They're optional, and the site works exactly the same either way. Privacy policy