16. As part of an experiment two groups of people, A and B, took the same general knowledge test.
The test had a maximum of 100 marks.
(a)
The first two columns of the table summarise the results of the test for the 45 people in Group A.
Mark
Frequency
Cumulative Frequency
\(0 \lt p \leqslant 20\)
0
0
\(20 \lt p \leqslant 40\)
3
3
\(40 \lt p \leqslant 60\)
20
\(60 \lt p \leqslant 80\)
15
\(80 \lt p \leqslant 100\)
7
(i) Complete the cumulative frequency column. [1]
(ii) Explain why 60 is a reasonable estimate of the median mark. [1]
(b)
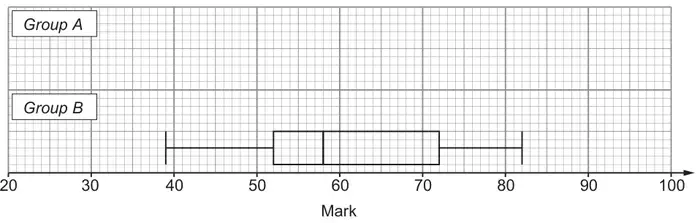
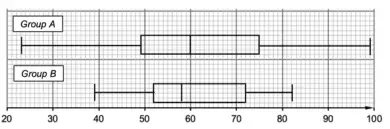
This box plot shows the distribution of the marks of the people in Group B.
(i)
For the people in Group A:
Minimum mark
Range
Lower Quartile
Median
Upper Quartile
23
76
49
60
75
Draw the box plot for Group A on the grid above. [3]
(ii) Make two comments to compare the results of Group A and Group B. One comment must include an appropriate average. The other comment must include a measure of spread. [2]
Comment 1 ……………………
Comment 2 ……………………
Mark scheme (a)
Scheme
Marks
Comments
(a)(i)
Mark
f
cf
\(0 \lt p \leqslant 20\)
0
0
\(20 \lt p \leqslant 40\)
3
3
\(40 \lt p \leqslant 60\)
20
23
\(60 \lt p \leqslant 80\)
15
38
\(80 \lt p \leqslant 100\)
7
45
B1
(a)(ii) Valid explanation e.g. ‘23 terms include all marks as far as 60’
E1
Allow valid explanations based on 22.5th term. Allow e.g. ‘23 people less than or equal to 60 and 22 people above 60
Must say more than ‘60 is in the middle group.’ FT ‘their 45’ providing from one error in arithmetic only
Mark scheme (b)
Scheme
Marks
Comments
(b)(i) Correct box plot Left whisker 23, LQ 49, median 60, UQ 75 and right whisker 99
B3
B2 for complete box plot with four correct values
B1 for any three values correctly plotted in a box plot or for maximum of 99 seen but not drawn on box plot.
(b)(ii) Valid comment comparing medians e.g. ‘On average, Group A did better than Group B as the median was 60 whereas Group B’s median was 58’ or ‘The medians are similar so there is not much difference between the groups.’
E1
Must be a comparison not simply a comment about one group Allow e.g. ‘Group A had a higher median (so did better on average)’. ’The average of group A is two marks higher’ ‘Group A had a higher average of 60’ as clearly using the median as the average.
Do not allow e.g. ‘Group A had a median of 60 and Group B had a median of 58.’ (no comparison) ‘The medians are similar’ without further explanation. ‘On average Group A were better’, (no reference to median or comparison of values).
Valid comment comparing IQRs or ranges e.g. ‘Group B’s results were less varied than Group A’s as the IQR was 20 which was less than Group A’s which was 26’ or ‘Group B’s results were more consistent than Group A’s as the range was 43 compared to Group A’s range of 76.’
E1
Must be a comparison not simply a comment about one group Allow e.g. ‘Group B’s marks were more consistent as the IQR is smaller’ Do not allow e.g. ‘Group A had a range of 76 and Group B had a range of 43.’ (no comparison) Do not allow if values contradict the statement e.g. ‘Group B has lower range, only 20 but A’s range is 26’ need IQR not range here.
(7)
Corrected by Westie's Workshop
The board's mark scheme printed “whereas Group A’s median was 58”. Changed to “Group B’s median was 58” because 58 is Group B’s median; Group A’s is 60.
The board's mark scheme printed “Group A’s range of 66”. Changed to “Group A’s range of 76” because the question gives Group A’s range as 76.
Original: see the board's mark scheme PDF (link above).
We'd like to use Google Analytics cookies to count visits and see which pages help most. They're optional, and the site works exactly the same either way. Privacy policy