
Foundation November 2022 Paper 1 Q2
2. The bar chart shows the percentage of households in the UK who owned at least one mobile phone in the years 2000 and 2009.
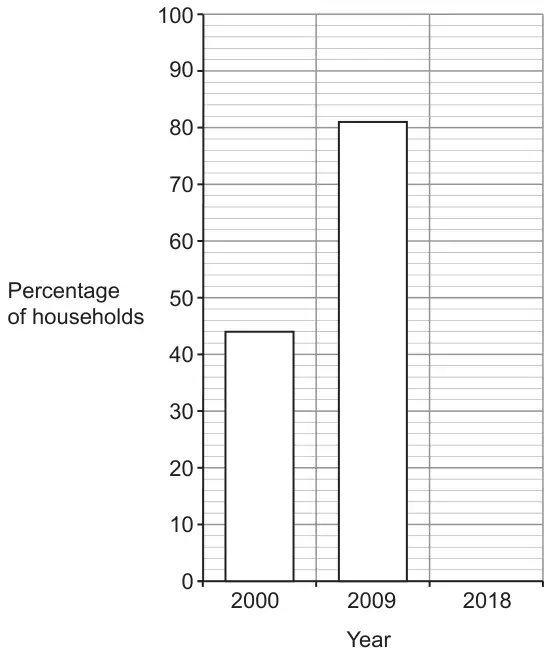
(a) What was the increase in the percentage of households who owned at least one mobile phone from 2000 to 2009? [2]
(b)
In 2018, 95% of households in the UK owned at least one mobile phone.
Complete the bar chart. [1]
(c) Comment on how mobile phone ownership seems to have changed between 2000 and 2018. [1]
| Scheme | Marks | Comments |
|---|---|---|
| 81 – 44 | M1 | Allow one error in reading scale e.g. 80 – 44 or 82 – 44 or 81 – 42. Calculation must be seen (or implied) for M1 A0. |
| 37(%) | A1 | CAO |
| Scheme | Marks | Comments |
|---|---|---|
| Correct bar at 95 | B1 | Allow good freehand. Ignore inconsistent width. |
| Scheme | Marks | Comments |
|---|---|---|
| Valid comment e.g. ‘(The percentage of people owning mobile phones seems to have been) increasing’ | E1 | If values are given, they have to be correct (44% and 95%) or FT from (a). Allow ‘change’ only if correct values are referred to. Accept ‘gone up’ and other informal references to an increase. |
| (4) |