
Foundation November 2021 Paper 1 Q17
17. Fifteen people aged between 40 and 60 take an eye test as part of an experiment.
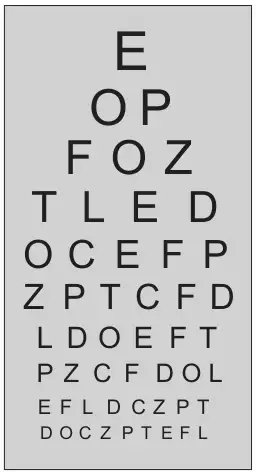
The test involves reading letters from a chart.
Each line of letters is smaller than the line above.
Letter size is measured in points.
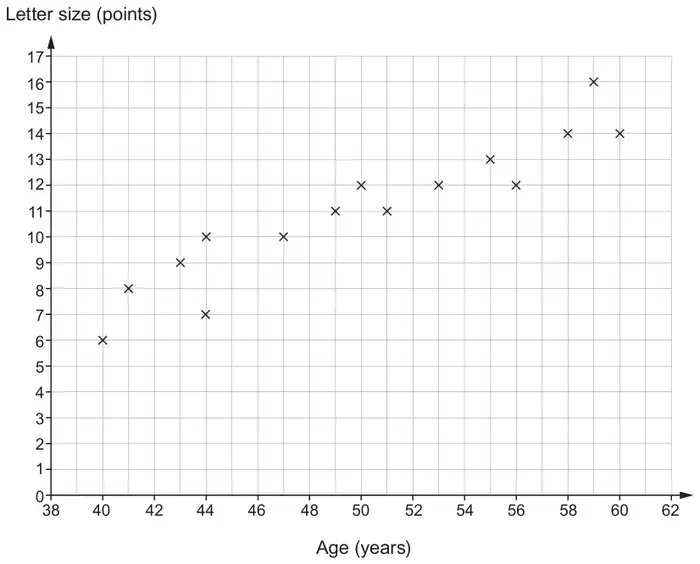
The scatter graph below shows the age of and the smallest letter size read by each person.
(a)
The mean age is 50 years and the mean letter size is 11 points.
Using this information, draw a line of best fit on the scatter graph. [2]
(b)
Use the scatter graph to answer each of the following questions.
(i) Estimate the smallest letter size which can be read by a person aged 52. [1]
(ii)
Jared is 30 years old.
Should the scatter graph be used to estimate the smallest letter size that Jared can read?
Yes ☐ No ☐
Give a reason for your answer. [1]
| Scheme | Marks | Comments |
|---|---|---|
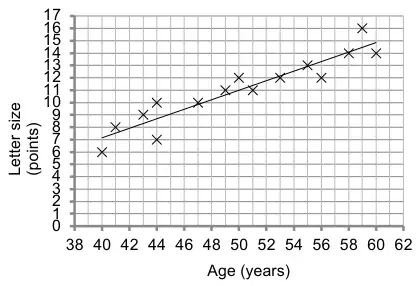
| Correct, ruled, single line of best fit drawn, passing through the point (50, 11) | B2 | Must have some points above and some points below the line and follow the trend of the data; if more than one line is drawn, mark the worst; must extend at least from age 42 to 58, may be longer but not shorter; For B2 or B1: if a point is plotted at (50, 11) mark clear intent to pass through (50, 11), if no point plotted must pass exactly through this point; B1 for a ruled, single line of best fit with some points above and some points below the line and following the trend of the data and extending at least from age 42 to 58 but not passing through (50, 11) or a ruled, single line of best fit with positive gradient passing through (50, 11) but not fitting criterion for points above and below and/or trend and/or length |
| Scheme | Marks | Comments |
|---|---|---|
| (i) Between 11 and 13 inclusive | B1 | If not in this range allow FT of ‘their line of best fit’ providing it is an attempt at a single line, ruled or unruled; allow answers in this range even if no line drawn; allow decimal answers; allow FT values to be rounded or truncated to the nearest integer |
| (ii) No indicated and a valid reason e.g. ‘There is no data for 30 years old’ or ‘Younger people often have better eyesight than older people.’ | E1 | Any reason that indicates Jared is outside the data set e.g. Accept: ‘His age is not on the scatter graph.’ Allow: ‘The lowest age on the graph is 38’ or ‘30 wasn’t listed’. Do not accept ‘Different ages, vision can vary between people.’ (too vague) Allow extra irrelevant comments providing they are not contradictory. |
| (4) |