
Higher June 2023 Paper 2 Q12
12. The box plot summarises the heights, in cm, of a class of students.
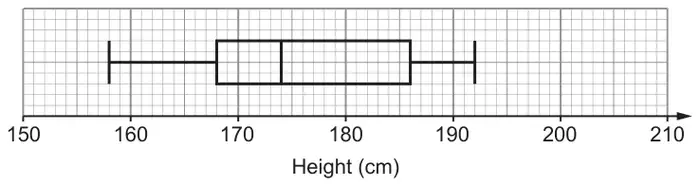
Use the box plot to complete the table. [3]
| Range | Median | Lower quartile | Upper quartile | Interquartile range |
|---|---|---|---|---|
| Scheme | Marks | Comments | ||||||||||
|---|---|---|---|---|---|---|---|---|---|---|---|---|
| B3 | If IQR not 18, FT IQR from ‘their UQ-LQ’ B2 for 4 correct values OR B1 for correct values for any one of the following:
| ||||||||||
| (3) |