
4400 Higher June 2005 Paper 4 Q5
5 The frequency diagram gives information about the marks gained by a group of 59 students in a test.
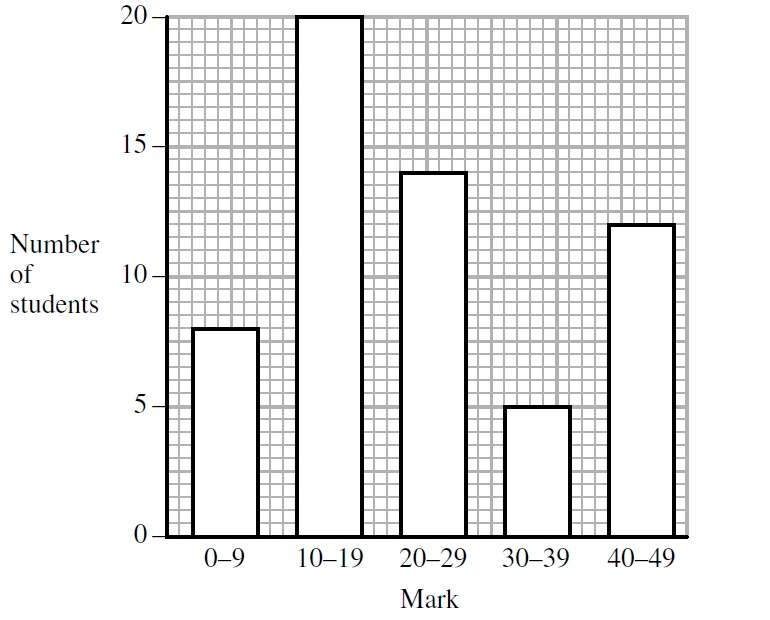
(a) Which is the modal class? (1)
A student is chosen at random from the whole group.
(b) Find the probability that this student’s mark is less than 30. (2)
(c) Calculate an estimate of the total number of marks scored by all the students in the group. (3)
| Scheme | Marks |
|---|---|
| 10–19 | B1 |
| (1) |
| Scheme | Marks |
|---|---|
| 42/59 or 0.71(….) or 71(…)% | B2 |
| (2) |
Notes
B2: B1 num, B1 denom
42 : 59 B1
| Scheme | Marks |
|---|---|
| 8 × 4.5 + 20 × 14.5 + 14 × 24.5 + 5 × 34.5 + 12 × 44.5 Midpoints 4.5 (or 5 or 4) etc | M1 M1 |
| 1375(.5) or 1376 | A1 |
| (3) | |
| (6 marks) |
Notes
M1: ≥ four \(fx\) attempted, consistent \(x\) within interval
M1: dep (for midpoints 4 or 5 etc)
A1: ISW eg ÷ 59
23.3, 1405, 1346 (no working): SC B2
22.8, 23.8 : SC B1