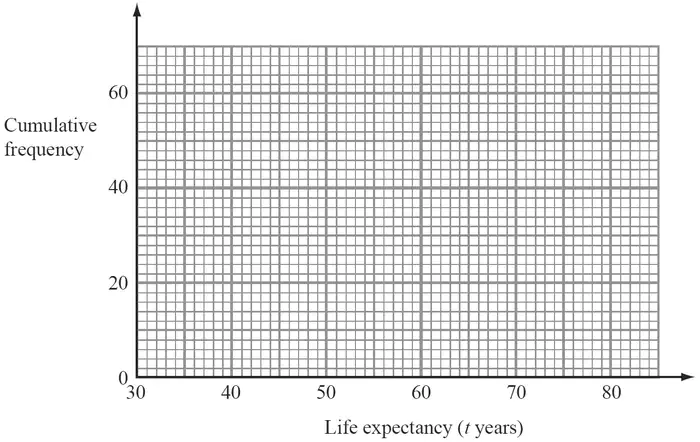
11 The grouped frequency table gives information about life expectancy in the 54 countries of the Commonwealth.
Life expectancy (\(t\) years)
Frequency
\(30 \lt t \leqslant 40\)
4
\(40 \lt t \leqslant 50\)
6
\(50 \lt t \leqslant 60\)
9
\(60 \lt t \leqslant 70\)
14
\(70 \lt t \leqslant 80\)
21
(a) Complete the cumulative frequency table.
Life expectancy (\(t\) years)
Cumulative frequency
\(30 \lt t \leqslant 40\)
\(30 \lt t \leqslant 50\)
\(30 \lt t \leqslant 60\)
\(30 \lt t \leqslant 70\)
\(30 \lt t \leqslant 80\)
(1)
(b) On the grid, draw the cumulative frequency graph for your table.(2)
(c) Use your graph to find an estimate for the median of the life expectancies in Commonwealth countries. (2)
Mark scheme (a)
Scheme
Marks
4 10 19 33 54
B1
(1)
Notes
B1: cao
Mark scheme (b)
Scheme
Marks
Points
B1
Curve
B1
(2)
Notes
B1: Allow \(\pm\frac{1}{2}\) sq ft from sensible table
B1: or line segments (dep on 4 pts correct or ft correctly or 5 ordinates from (a) plotted correctly and consistently within intervals but not above end points)
Mark scheme (c)
Scheme
Marks
27 (or \(27\frac{1}{2}\)) indicated on graph or stated
M1
\(\approx 66\)
A1
(2)
(5 marks)
Notes
M1: for 27 (or \(27\frac{1}{2}\)) indicated on graph or stated