
4400 Higher June 2009 Paper 3 Q10
10 The table shows information about the distances walked in a week by 40 people.
| Distance (\(d\) km) | Frequency |
|---|---|
| \(0 \lt d \leqslant 20\) | 8 |
| \(20 \lt d \leqslant 40\) | 24 |
| \(40 \lt d \leqslant 60\) | 5 |
| \(60 \lt d \leqslant 80\) | 2 |
| \(80 \lt d \leqslant 100\) | 1 |
(a) Work out an estimate for the mean distance walked in a week by the 40 people. (4)
The information in the table was used to draw the cumulative frequency graph.
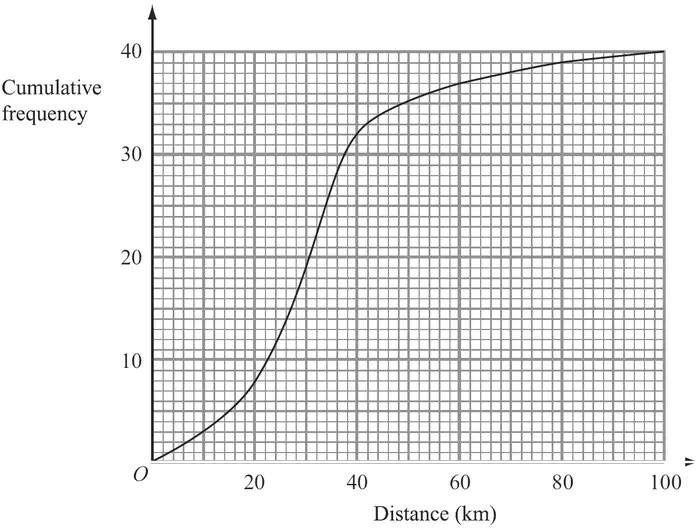
(b) Find an estimate for the number of people who walked less than 25 km. (2)
(c) Find an estimate for the interquartile range of the distances walked by the 40 people. (2)
| Scheme | Marks |
|---|---|
| \(10 \times 8 + 30 \times 24 + 50 \times 5 + 70 \times 2 + 90 \times 1\) or 80 + 720 + 250 + 140 + 90 or 1280 | M1 M1 |
| \(\dfrac{\text{“}1280\text{”}}{40}\) | M1 |
| 32 | A1 |
| (4) |
Notes
M1 M1: M1 for finding at least three products \(f \times x\) consistently within intervals (inc end points) and summing them
M1 (dep) for use of halfway values
M1: (dep on 1st M1) for division by 40 or division by their 8 + 24 + 5 + 2 + 1
A1: cao
| Scheme | Marks |
|---|---|
| \(d = 25\) indicated on graph | M1 |
| 12 or 13 | A1 |
| (2) |
Notes
A1: Accept 12 − 13 inc
| Scheme | Marks |
|---|---|
| 10 and 30 or \(10\frac{1}{4}\) and \(30\frac{3}{4}\) indicated on cumulative frequency axis or stated | M1 |
| 14 − 17 inc | A1 |
| (2) | |
| (8 marks) |