
4400 Higher June 2009 Paper 4 Q6
6 The diagram shows a biased spinner, numbered 1, 2, 3 and 4
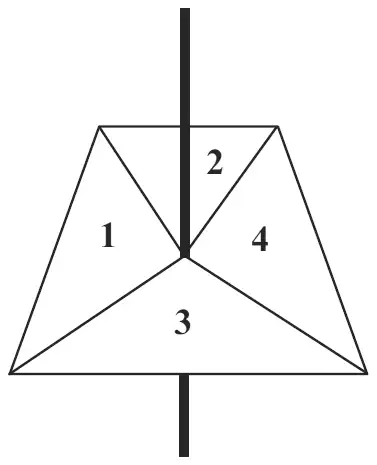
Diagram NOT accurately drawn
When the spinner is spun, the number on which it lands is the score.
The table shows the probabilities for three of the scores.
| Score | Probability |
|---|---|
| 1 | 0.3 |
| 2 | 0.1 |
| 3 | 0.4 |
| 4 |
The spinner is spun once.
Work out the probability that the score is
(a) 4 (2)
(b) an odd number. (2)
| Scheme | Marks |
|---|---|
| 1 − (0.3 + 0.1 + 0.4) | M1 |
| 0.2 oe | A1 |
| (2) |
Notes
A1: Look for answer in table if missing from answer line
| Scheme | Marks |
|---|---|
| 0.3 + 0.4 | M1 |
| 0.7 oe | A1 |
| (2) | |
| (4 marks) |