
4MA0 Foundation June 2011 Paper 2 Q2
2 The pictogram shows information about the number of goals scored by Newton United in 3 months of a football season.
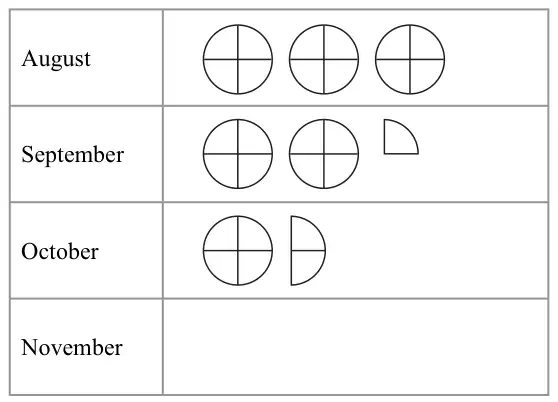
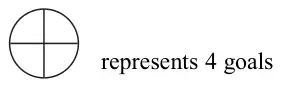
(a) How many goals did Newton United score in August? (1)
(b) How many more goals did Newton United score in September than in October? (2)
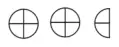
In November, Newton United scored 10 goals.
(c) Show this information on the pictogram. (1)
Newton United scored 20% of their 10 goals in November from headers.
(d) Work out 20% of 10 (2)
| Scheme | Marks |
|---|---|
| 12 | B1 |
| (1) |
| Scheme | Marks |
|---|---|
| 9 – 6 | M1 |
| 3 | A1 |
| (2) |
| Scheme | Marks |
|---|---|
 | B1 |
| (1) |
Notes
B1: two full circles and one semi-circle or 10 quarter circles
| Scheme | Marks |
|---|---|
| 20/100 × 10 oe | M1 |
| 2 | A1 |
| (2) | |
| (Total 6 marks) |