
4MA0 Foundation June 2012 Paper 2 Q14
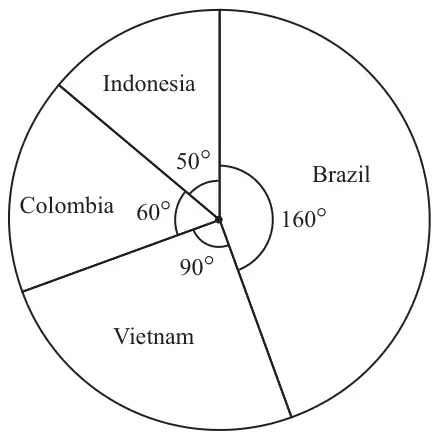
14 The pie chart shows information about the amount of coffee produced in four countries, in one year.
(a)
(i) Write down the ratio of the amount of coffee produced in Colombia to the amount of coffee produced in Vietnam.
Give your answer in its simplest form.
Give your answer in its simplest form.
(ii) In this year, Indonesia produced 0.7 million tonnes of coffee.
Work out how much coffee Brazil produced.
(5)Work out how much coffee Brazil produced.
(b) A second pie chart is to be drawn for tea production.
4 million tonnes of tea was produced in one year.
China produced 1.2 million tonnes of tea in this year.
Calculate the size of the angle for China in this second pie chart. (2)
4 million tonnes of tea was produced in one year.
China produced 1.2 million tonnes of tea in this year.
Calculate the size of the angle for China in this second pie chart. (2)
| Scheme | Marks |
|---|---|
| (i) Answer: 60 : 90 | M1 |
| 2 : 3 | A1 |
| (ii) 160 ÷ 50 × 0.7 oe or 160 ÷ 50 × 700000 | M2 |
| 2.24 | A1 |
| (5) |
Notes
M1: any correct un-simplified ratio (e.g. 6:9 or 20:30 etc.)
A1: SC B1 for 3 : 2 or 1 : 1.5
NB. must be colon notation to gain marks (i.e not decimal points or fractions)
M2: M1 for 160 ÷ 50 (=3.2) or 50 ÷ 160 (=0.3125) or 0.7 ÷ 50 (=0.014) or 50 ÷ 0.7 (=71.42..)
A1: Accept 2240000
Alt method (a)(ii)
| Scheme | Marks |
|---|---|
| (150° =) 0.7 × 3 (=2.1) | M1 |
| (10° =) 0.7 ÷ 5 (=0.14) + (“0.7 × 3”) | M1 |
| 2.24 | A1 |
Notes
A1: Accept 2240000
| Scheme | Marks |
|---|---|
| 1.2 ÷ 4 × 360 oe | M1 |
| 108° | A1 |
| (2) | |
| (Total 7 marks) |