
4MA0 Higher June 2017 Paper 3R Q12
12 The table gives information about the number of males in each age group in a survey of 100 males working in Singapore in 2014.
| Age (\(A\) years) | Frequency |
|---|---|
| \(15 \leqslant A \lt 20\) | 2 |
| \(20 \leqslant A \lt 25\) | 7 |
| \(25 \leqslant A \lt 30\) | 9 |
| \(30 \leqslant A \lt 35\) | 10 |
| \(35 \leqslant A \lt 40\) | 11 |
| \(40 \leqslant A \lt 45\) | 12 |
| \(45 \leqslant A \lt 50\) | 12 |
| \(50 \leqslant A \lt 55\) | 12 |
| \(55 \leqslant A \lt 60\) | 11 |
| \(60 \leqslant A \lt 65\) | 14 |
| Age (\(A\) years) | Cumulative frequency |
|---|---|
| \(15 \leqslant A \lt 20\) | |
| \(15 \leqslant A \lt 25\) | |
| \(15 \leqslant A \lt 30\) | |
| \(15 \leqslant A \lt 35\) | |
| \(15 \leqslant A \lt 40\) | |
| \(15 \leqslant A \lt 45\) | |
| \(15 \leqslant A \lt 50\) | |
| \(15 \leqslant A \lt 55\) | |
| \(15 \leqslant A \lt 60\) | |
| \(15 \leqslant A \lt 65\) |
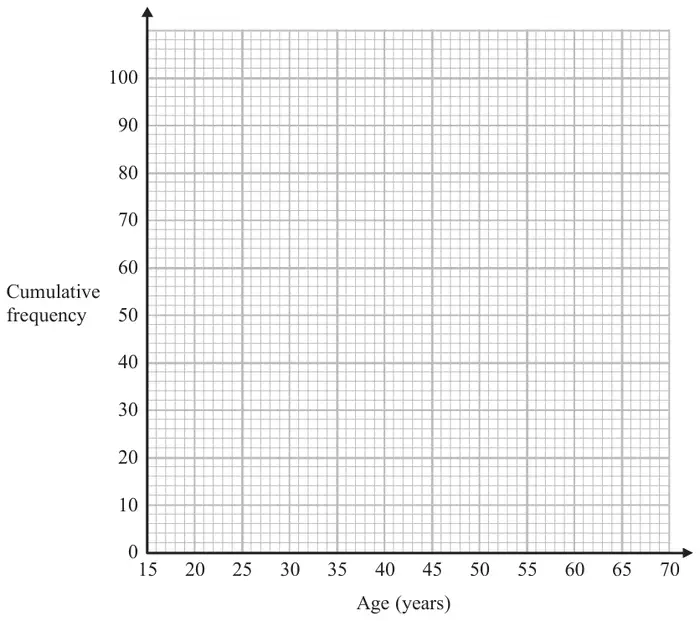
The total number of males aged under 65 working in Singapore in 2014 was 1 200 000
Using this information and your graph,
| Scheme | Marks |
|---|---|
| 2, 9, 18, 28, 39, 51, 63, 75, 86, 100 Answer: Correct table | B1 |
| (1) |
| Scheme | Marks |
|---|---|
| M1 | |
Correct cf graph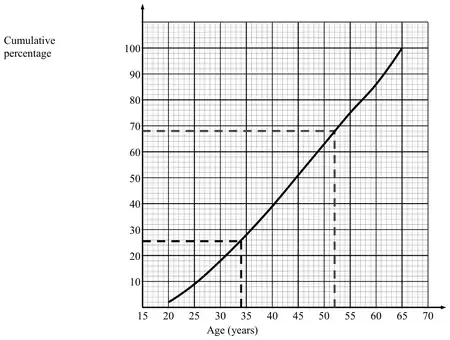 | A1 |
| (2) |
Notes
M1: (ft from sensible table i.e. clear attempt at addition)
for at least 8 points plotted correctly at end of interval
or
for all 10 points plotted consistently within each interval in the freq table at the correct height
A1: accept curve or line segments
accept graph that is not joined to (15, 0) (corrected from the printed mark scheme: “(0,15)”)
| Scheme | Marks |
|---|---|
| E.g. for a mark drawn at 25 on their cumulative frequency diagram | M1 |
| 33 – 35 | A1 |
| (2) |
Notes
M1: for intention to use 25 on cf axis
ft from a cumulative frequency graph provided method is shown
A1: 33 - 35
ft from a cumulative frequency graph provided method is shown
| Scheme | Marks |
|---|---|
| E.g. reading of 66 – 68 (%) or reading from graph at \(A = 52\) or mark on cf axis from using \(A = 52\) | M1 |
| \(\dfrac{\text{“}68\text{”}}{100} \times 1200(000)\) | M1 |
| 792000 – 816000 | A1 |
| (3) | |
| (8 marks) |
Notes
M1: for a reading taken from 52 on age axis
ft from a cumulative frequency graph provided method is shown
M1: (dep)
A1: for answer in the range 792000 – 816000