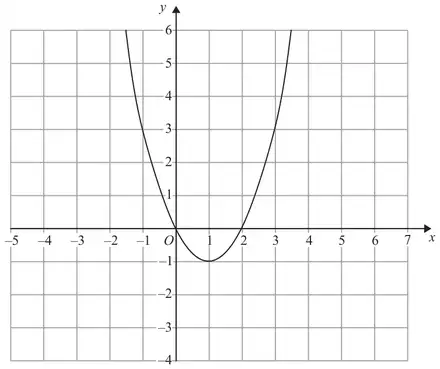
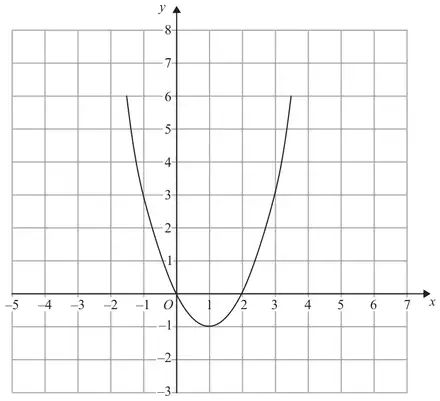
B2 for a parabola with min (4, –1), through (2, 3), (6, 3),(3, 0), (5, 0) (B1 for a parabola with min (4, –1) or a parabola through (2, 3) and (6, 3) or a parabola through (3, 0) and (5, 0) or a translation of the given parabola along the x-axis by any value other than +3 with the points (–1, 3) (0, 0) (1, –1) (2, 0) (3, 3) all translated by the same amount)
Mark scheme (b)
Answer
Mark
Notes
Parabola through (1, –2), (0, 0), (2, 0)
2
B2 parabola with min (1, –2), through (0, 0) and (2, 0) (B1 parabola with min (1, –2) or parabola through (0, 0), (2, 0) (-1, 6) and (3, 6))