
1MA0 Higher November 2012 Paper 1 Q2
2 The scatter graph shows information about the height and the arm length of each of 8 students in Year 11
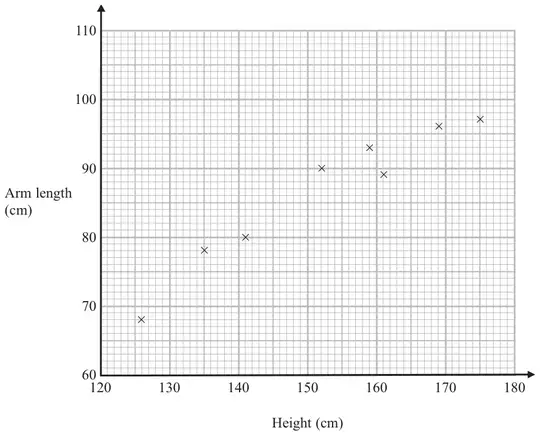
(a) What type of correlation does this scatter graph show? (1)
A different student in Year 11 has a height of 148 cm.
(b) Estimate the arm length of this student. (2)
| Answer | Mark | Notes |
|---|---|---|
| Positive (correlation) | 1 | B1 for positive (correlation) [do not accept a relationship] |
| Answer | Mark | Notes |
|---|---|---|
| 85 | 2 | B2 for an answer in the range 83 to 87 OR M1 for a single straight line segment with positive gradient that could be used as a line of best fit or for an indication on the diagram from 148 on the height axis A1 ft from their line of best fit |