
1MA0 Higher March 2013 Paper 1 Q2
2 The scatter graph shows information about 10 apartments in a city.
The graph shows the distance from the city centre and the monthly rent of each apartment.
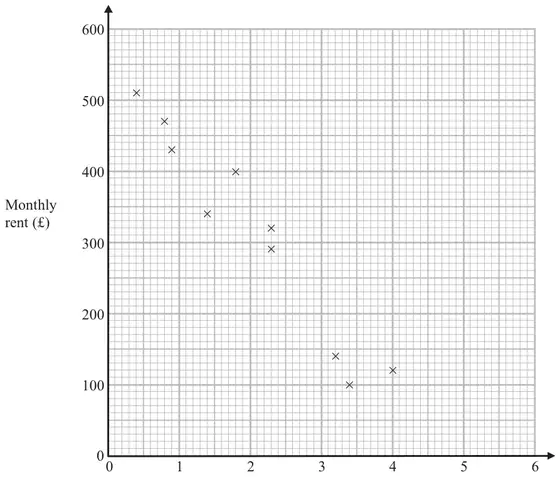
The table shows the distance from the city centre and the monthly rent for two other apartments.
| Distance from the city centre (km) | 2 | 3.1 |
|---|---|---|
| Monthly rent (£) | 250 | 190 |
(a) On the scatter graph, plot the information from the table. (1)
(b) Describe the relationship between the distance from the city centre and the monthly rent. (1)
An apartment is 2.8 km from the city centre.
(c) Find an estimate for the monthly rent for this apartment. (2)
| Answer | Mark | Notes |
|---|---|---|
| Plot points | 1 | Plot (2, 250) and (3.1, 190) B1 for both points plotted accurately |
| Answer | Mark | Notes |
|---|---|---|
| Relationship | 1 | B1 for “As the distance from the centre increases the monthly rent decreases” or the nearer you are to the centre the more you have to pay oe (accept negative correlation) |
| Answer | Mark | Notes |
|---|---|---|
| 200 to 260 | 2 | M1 for attempting a correct method, eg a line of best fit or any other indication, on a line that could be used as a line of best fit eg line to graph at \(x = 2.8\) or a mark on the line at 2.8 A1 for value in the range 200 to 260 |