
1MA0 Foundation June 2012 Paper 2 Q26
26 The scatter graph shows some information about 8 cars.
For each car it shows the engine size, in litres, and the distance, in kilometres, the car travels on one litre of petrol.
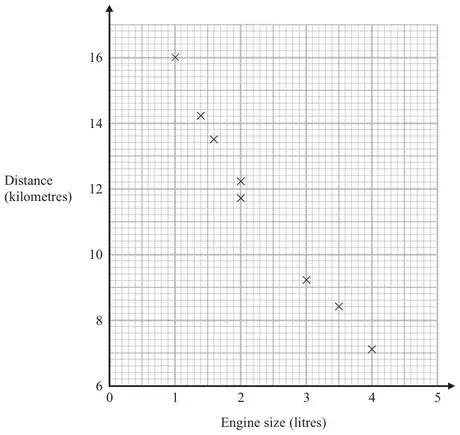
(a) What type of correlation does the scatter graph show? (1)
A different car of the same type has an engine size of 2.5 litres.
(b) Estimate the distance travelled on one litre of petrol by this car.
kilometres (2)
kilometres (2)
| Answer | Mark | Notes |
|---|---|---|
| negative | 1 | B1 for negative |
| Answer | Mark | Notes |
|---|---|---|
| 10.3 - 11.7 | 2 | M1 for a single straight line segment with negative gradient that could be used as a line of best fit or an indication on the diagram from 2.5 on the \(x\) axis A1 for an answer in the range 10.3 – 11.7 inclusive |