
1MA0 Foundation March 2013 Paper 2 Q21
21 Simon went for a cycle ride.
He left home at 2 pm.
The travel graph represents part of Simon’s cycle ride.
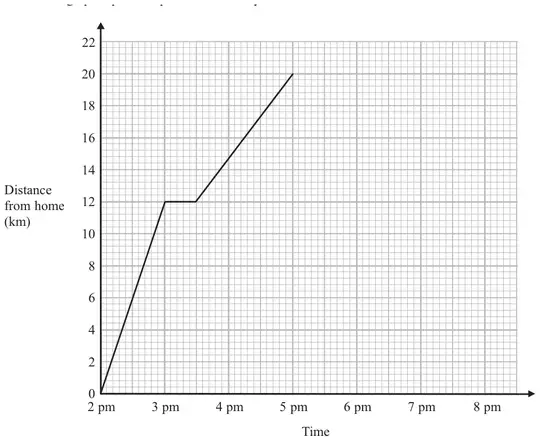
At 3 pm Simon stopped for a rest.
(a) How many minutes did he rest? (1)
(b) How far was Simon from home at 5 pm?
km (1)
km (1)
At 5 pm Simon stopped for 30 minutes.
Then he cycled home at a steady speed.
It took him 1 hour 30 minutes to get home.
(c) Complete the travel graph. (2)
| Answer | Mark | Notes |
|---|---|---|
| 30 | 1 | B1 for 30 minutes oe |
| Answer | Mark | Notes |
|---|---|---|
| 20 | 1 | B1 cao |
| Answer | Mark | Notes |
|---|---|---|
| graph completed | 2 | B1 for horizontal line from (5, 20) to (5.30, 20) B1 for a single straight line with the correct gradient from ‘(5.30, 20)’ to the time axis |