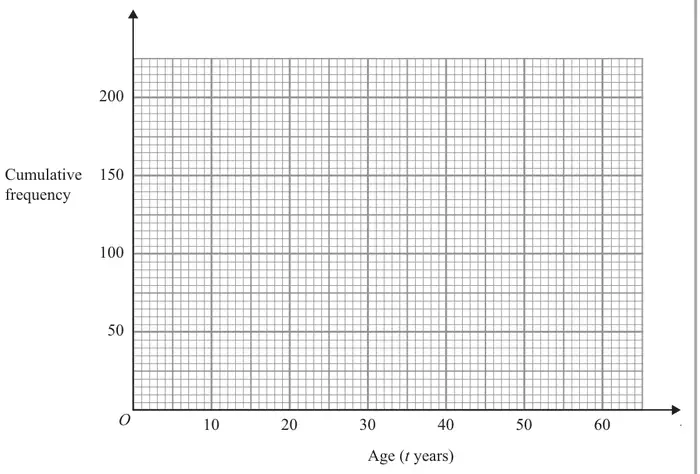
14 The grouped frequency table gives information about the ages of 200 elephants.
Age (\(t\) years)
Frequency
\(0 \lt t \leqslant 10\)
55
\(10 \lt t \leqslant 20\)
60
\(20 \lt t \leqslant 30\)
40
\(30 \lt t \leqslant 40\)
22
\(40 \lt t \leqslant 50\)
13
\(50 \lt t \leqslant 60\)
10
(a) Complete the cumulative frequency table.
Age (\(t\) years)
Cumulative frequency
\(0 \lt t \leqslant 10\)
\(0 \lt t \leqslant 20\)
\(0 \lt t \leqslant 30\)
\(0 \lt t \leqslant 40\)
\(0 \lt t \leqslant 50\)
\(0 \lt t \leqslant 60\)
(1)
(b) On the grid, draw a cumulative frequency graph for your table.(2)
(c) Use the graph to find an estimate for the number of elephants with ages of more than 26 years. (2)
Mark scheme (a)
Scheme
Marks
55 115 155 177 190 200
B1
(1)
Notes
B1: cao
Apart from Questions 3, 13(b) and 17(f) (where the mark scheme states otherwise), the correct answer, unless clearly obtained by an incorrect method, should be taken to imply a correct method.
Mark scheme (b)
Scheme
Marks
Points correct
B1
Curve or line segments
B1
(2)
Notes
B1: ± ½ sq ft from sensible table ie clear attempt to add frequencies
B1: ft from points if 4 or 5 correct or ft correctly from sensible table or if points are plotted consistently within each interval at the correct heights Accept curve which is not joined to the origin
Mark scheme (c)
Scheme
Marks
26 indicated on cf graph
M1
approx 60 from correct graph
A1
(2)
(Total 5 marks)
Notes
M1: for 26 indicated on cf graph – accept 26-27 inc
A1: If M1 scored, ft from cf graph If M1 not scored, ft only from correct curve & if answer is correct (± ½ sq tolerance) award M1 A1