
4MA0 Higher January 2012 Paper 3 Q16
16 The incomplete table shows information about the times, in minutes, that runners took to complete a race.
| Time (\(t\) minutes) | \(30 \leqslant t \lt 35\) | \(35 \leqslant t \lt 40\) | \(40 \leqslant t \lt 50\) | \(50 \leqslant t \lt 60\) | \(60 \leqslant t \lt 80\) |
|---|---|---|---|---|---|
| Number of runners | 12 | 20 | 12 | 16 |
(a) Use the histogram to calculate the number of runners who took between 40 and 50 minutes to complete the race. (2)
(b) Complete the histogram for the remaining results.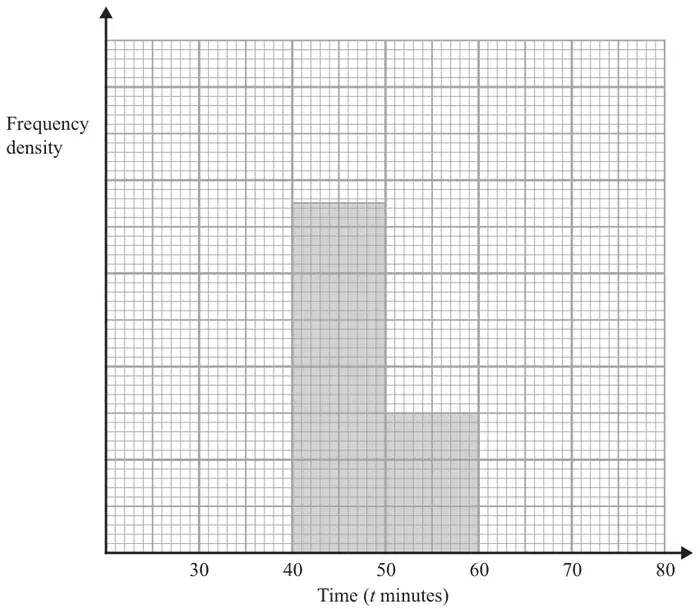
Runners who achieved a time between 37 and 48 minutes to complete the race were each awarded a silver medal.
(c) Calculate an estimate of the number of runners awarded silver medals. (2)
| Scheme | Marks |
|---|---|
| 10 × 3 or 15 × 2 or 12 × 7.5/3 | M1 |
| 30 | A1 |
| (2) |
Notes
M1: or any correct fd in correct position and no errors, or 1 sq = 2 (runners) indicated.
| Scheme | Marks |
|---|---|
| Missing blocks = 6cm, 10cm, 2cm | B2 |
| (2) |
Notes
B2: 3 correct blocks B1 1 or 2 correct blocks
| Scheme | Marks |
|---|---|
| 0.6 × 20 + 0.8 × “30” or 3 × “4” + 8 × “3” or 450 × 0.08 | M1 |
| 36 | A1 cao |
| (2) | |
| (Total 6 marks) |
Notes
M1: (partitioning blocks)
(time × fd’s) {must see clear evidence that fd values used}.
450 small squares.