
4MA0 Higher June 2012 Paper 3 Q12
12 The cumulative frequency graph gives information about the lengths, in minutes, of 80 telephone calls.
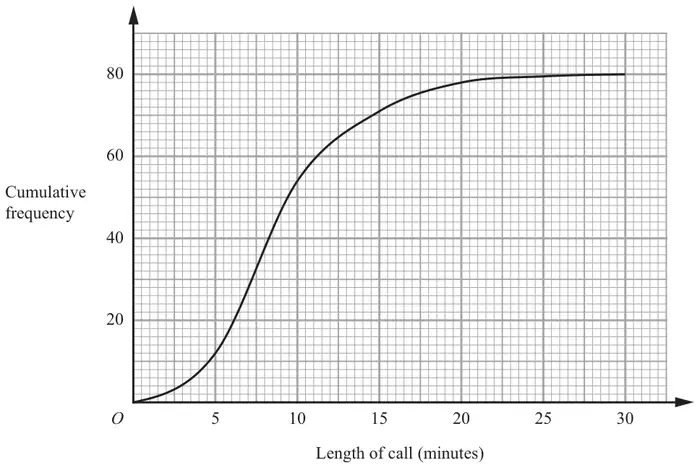
(a) Find an estimate for the number of calls which were longer than 15 minutes. (2)
(b) Find an estimate for the interquartile range of the lengths of the 80 calls. (2)
| Scheme | Marks |
|---|---|
| \(l\) = 15 indicated on graph or 70-72 inc stated | M1 |
| 9 | A1 |
| (2) |
Notes
A1: Accept 8-10 inc
Apart from Questions 9, 13, 18, 20 and 21 (where the mark scheme states otherwise) the correct answer, unless clearly obtained by an incorrect method, should be taken to imply a correct method.
| Scheme | Marks |
|---|---|
| 20 and 60 or \(20\frac{1}{4}\) and \(60\frac{3}{4}\) indicated on cumulative frequency axis or stated or 6-6.5 and 11-11.5 stated | M1 |
| 4.5-6 inc | A1 |
| (2) | |
| (Total 4 marks) |
Notes
A1: An answer in the range 5-6 inc with no indication of method scores 2 marks
BUT do not award A1 if an answer in the range 5-6 inc has clearly been obtained by finding the difference between two values, one or both of which are outside the ranges 6-6.5 and 11-11.5
For example, if working is 12 − 7 or 12 − 6 do not award A1.