
4MA0 Foundation June 2015 Paper 1 Q20
20 The pie chart gives information about the amounts spent by a gas company in one year.
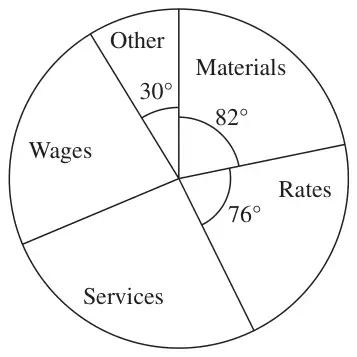
Diagram NOT accurately drawn
The amount spent on materials was 225.5 million euros.
The amount spent on services was the same as the amount spent on wages.
Work out the amount spent on services.
(3)
| Scheme | Marks |
|---|---|
| (360 − 76 − 82 − 30) ÷ 2 = 86 or 225.5 ÷ 82 (= 2.75) or 225.5 ÷ 82 × \(a\) where \(a \neq 86\) or 225.5 ÷ 82 × (360 – 76 – 82 − 30) oe (= 473) | M1 |
| 225.5 ÷ 82 × “86” or 225.5 ÷ 22.7.. × 23.8… or digits 236… or “473” ÷ 2 | M1 |
| 236.5 | A1 |
| (3) | |
| Total 3 marks |
Notes
M1: Accept digits 2255(000…) in place of 225.5 in both method marks
M1: (dep) for complete method
(NB: 82 and 86 may be converted to percentage of 360 – and then these percentages used
\(\dfrac{82}{360} = 22.7..\%\) or 23%; \(\dfrac{86}{360} = 23.8..\%\) or 24%)
A1: oe accept 236.5 million or 236 500 000