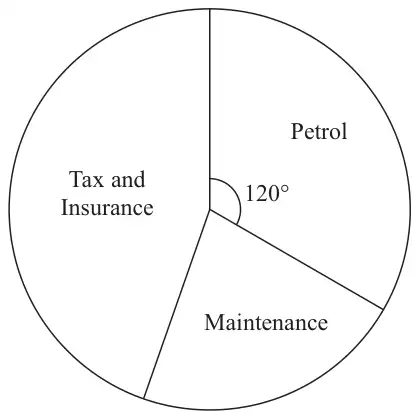
(a) The pie chart shows information about the amounts Mrs Gupta spent in one year to run her car. She spent a total of £1800Work out how much Mrs Gupta spent on petrol for her car in the year. (2)
(b) The table shows the cost of the electricity, used by the Gupta family, for each 3-month period in one year.
Months
Cost of electricity (£)
January – March
300
April – June
140
July – September
100
October – December
260
Total
800
Rohit Gupta must draw a pie chart for this information for his maths homework. Work out the angle in the pie chart for the 3-month period from July to September. (2)