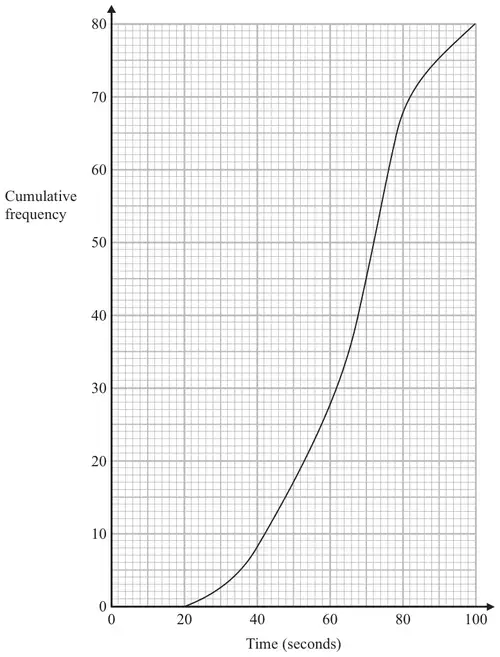
18 The cumulative frequency graph shows information about the times 80 swimmers take to swim 50 metres.
(a) Use the graph to find an estimate for the median time. (1)
A swimmer has to swim 50 metres in 60 seconds or less to qualify for the swimming team.
The team captain says,
“More than 25% of swimmers have qualified for the swimming team.”
*(b) Is the team captain right? You must show how you got your answer. (3)
For these 80 swimmers the least time taken was 28 seconds and the greatest time taken was 96 seconds.
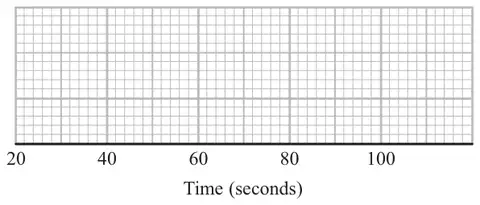
(c) Use the cumulative frequency graph and the information above to draw a box plot for the times taken by the swimmers.(3)
Mark scheme (a)
Answer
Mark
Notes
68
1
B1 cao
Mark scheme (b)
Answer
Mark
Notes
Yes as \(28 \gt 20\) or \(35\% \gt 25\%\) or \(53 \lt 60\)
3
M1 for reading a value from graph at time = 60 (=28, accept 27 to 28) M1 for ‘28’ \(\div 80 \times 100\) (= 35) or \(25 \div 100 \times 80\) (= 20) C1 (dep on M2) for correct decision based on their figures
OR
M1 for \(25 \div 100 \times 80\) (= 20) M1 for reading a value from graph at cf = 20 (=53, accept 52 to 54) C1 (dep on M2) for correct decision based on their figures
Mark scheme (c)
Working
Answer
Mark
Notes
28, 53, 68, 76, 96
Box plot plotted
3
B1 for ends of whiskers at 28 and 96 with a box B1 ft for median at ‘68’ inside a box B1 for ends of box at 53 (accept 52 to 54) and 76