
1MA0 Higher June 2014 Paper 1 Q16
16 Colin took a sample of 80 football players.
He recorded the total distance, in kilometres, each player ran in the first half of their matches on Saturday.
Colin drew this box plot for his results.
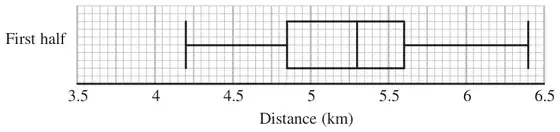
(a) Work out the interquartile range. (2)
There were 80 players in Colin’s sample.
(b) Work out the number of players who ran a distance of more than 5.6 km. (2)
Colin also recorded the total distance each player ran in the second half of their matches.
He drew the box plot below for this information.
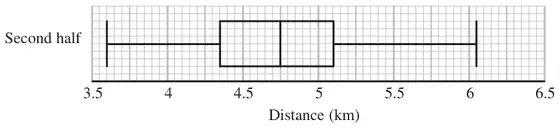
(c) Compare the distribution of the distances run in the first half with the distribution of the distances run in the second half. (2)
| Answer | Mark | Notes |
|---|---|---|
| 0.75 | 2 | M1 for \(\text{``}5.6\text{''} - \text{``}4.85\text{''}\) with at least one value correct A1 cao |
| Answer | Mark | Notes |
|---|---|---|
| 20 | 2 | M1 for a complete method e.g. \(80 \div 4\) A1 cao |
| Answer | Mark | Notes |
|---|---|---|
| 2 comparisons | 2 | B1 ft from (a) for a correct comparison of a measure of spread B1 for a correct comparison of medians (accept averages) For the award of both marks at least one of the comparisons made must be in the context of the question. |
Working
| 1st half | 2nd half | |
|---|---|---|
| Med | 5.3 | 4.75 |
| Range | 2.2 | 2.45 |
| IQR | 0.75 | 0.75 |