
4MA0 Higher June 2014 Paper 3R Q15
15 The histogram shows information about the times taken by a telephone call centre to answer incoming calls.
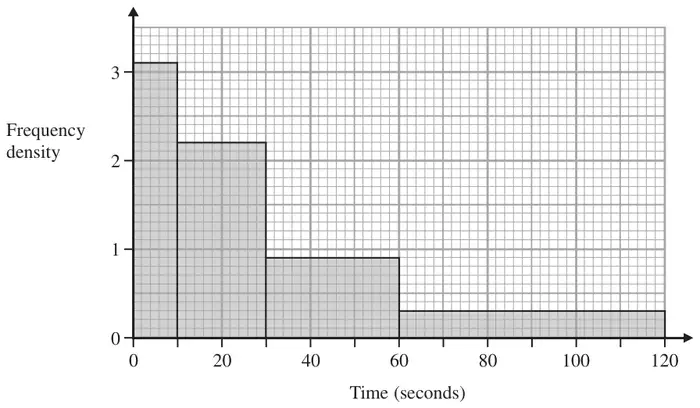
Work out an estimate for the percentage of calls that are answered in less than 40 seconds.
(3)
| Scheme | Marks |
|---|---|
| (3.1 x 10) + (2.2 x 20) + (0.9 x 30) + (0.3 x 60) or 31 + 44 + 27 + 18 (=120) or 120 or 12 or 1200 or 600 or 24 oe Or (3.1 x 10) + (2.2 x 20) + (0.9 x 10) or 31 + 44 + 9(=84) or 84 or 8.4 or 840 or 420 or 16.8 oe | M1 |
| \(\frac{84}{120}\) or \(\frac{8.4}{12}\) or \(\frac{840}{1200}\) or \(\frac{8}{24}\) or \(\frac{420}{600}\) or \(\frac{16.8}{24}\) oe | M1ft |
| 70 | A1 |
| (3) | |
| (3 marks) |
Notes
M1: For a correct method to work out the total area (by using freq density, counting squares, oe) or for a correct method to work out the total area less than 40 calls (by using freq density, counting squares, oe). Allow one error
M1ft: For a correct fraction \(\frac{a}{120}\) oe, or \(\frac{84}{b}\) oe where \(a < 120\) oe and \(b > 84\) oe
A1: cao