
4MA0 Higher January 2014 Paper 4 Q16
16 The histogram shows information about the times, \(t\) minutes, customers spent in a post office.
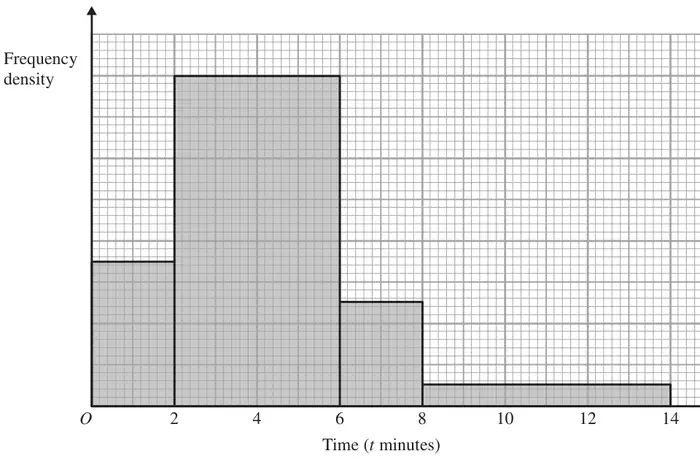
28 customers spent 2 minutes or less in the post office.
Calculate an estimate for the number of customers who spent between 5 and 14 minutes in the post office.
(3)
| Scheme | Marks |
|---|---|
| M1 | |
| (8x4)+(5x4)+(3x4) or 0.16({5x40}+{10x12.5}+{30x2.5}) | M1 |
| 64 | A1 |
| (3) | |
| (3 marks) |
Notes
M1: Correct fd calculated (or marked on vertical axis with no contradictions).
or 28 ÷ 2 or 14
or 32, 20, 12 frequencies assigned to correct blocks.
or 1 cm2 = 4 customers oe
or 1 small square = 0.16 customers oe
M1: Correct calculations to give 3 correct frequencies with the intention to add (32 + 20 + 12)
A1: cao