
4MA0 Higher June 2014 Paper 3R Q10
10 The cumulative frequency graph gives information about the monthly rainfall, in millimetres, in the United Kingdom during 120 months in the years 2001 to 2010.
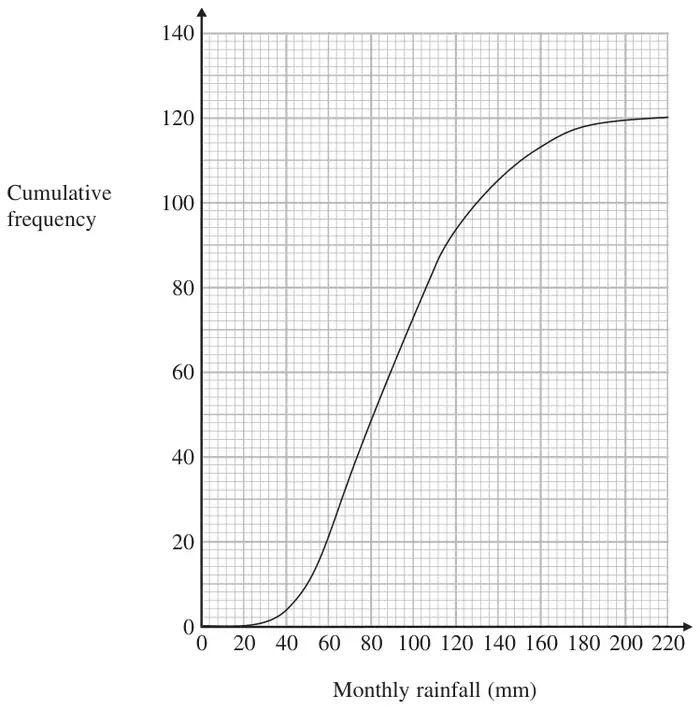
(a) Use the graph to estimate the number of months for which rainfall was less than 50 mm. (1)
(b) Use the graph to find an estimate for the median monthly rainfall. (1)
(c) Use the graph to find an estimate for the interquartile range of the monthly rainfall. (2)
| Scheme | Marks |
|---|---|
| 10 | B1 |
| (1) |
Notes
B1: Allow values from 8-12
| Scheme | Marks |
|---|---|
| 90 | B1 |
| (1) |
Notes
B1: Allow values in range 88-92
| Scheme | Marks |
|---|---|
| \(Q_1 \approx 68\) at CF = 30 or 30.25 \(Q_3 \approx 118\) at CF = 90 or 90.75 | M1 |
| 50 | A1 |
| (2) | |
| (4 marks) |
Notes
M1: for 30 and 90, or 30.25 and 90.75, or 68 (64 - 68) and 118 (115-119) stated or indicated on graph.
A1: Ft their values for Lower Quartile and Upper Quartile as long as in given range