
4MA0 Higher June 2014 Paper 4 Q22
22 The table shows information about the times, in minutes, that 100 shoppers spent in a supermarket.
| Time (\(t\) minutes) | Frequency |
|---|---|
| \(10 \leqslant t \lt 15\) | 6 |
| \(15 \leqslant t \lt 20\) | 10 |
| \(20 \leqslant t \lt 30\) | 20 |
| \(30 \leqslant t \lt 40\) | 36 |
| \(40 \leqslant t \lt 60\) | 28 |
Draw a histogram to show this information.
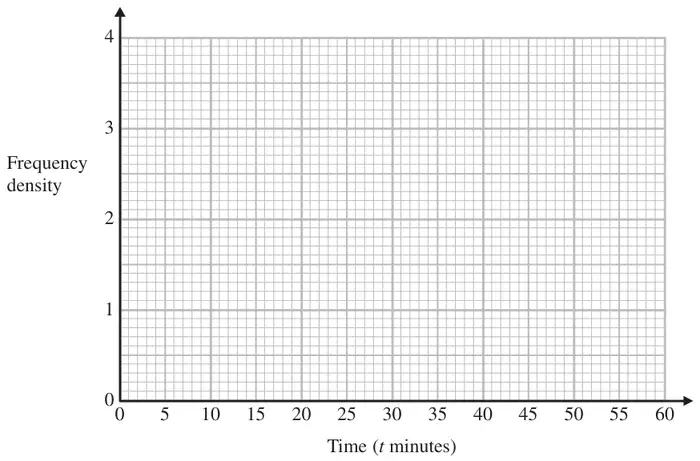
(3)
| Scheme | Marks |
|---|---|
| Bars of height 1.2 , 2, 2, 3.6, 1.4 | M1 |
| M1 | |
| correct histogram | A1 |
| (3 marks) |
Notes
M1: for use of frequency ÷ class width may be implied by 3 correct bars or 3 of 6÷5(=1.2) , 10 ÷ 5(=2) , 20 ÷ 10(=2) , 36 ÷ 10(=3.6) , 28 ÷ 20(=1.4)
M1: for at least 4 bars correct or
all of 1.2, 2, 2, 3.6 and 1.4 (can be implied by correct heights)
A1: fully correct histogram
SC: B2 for all bars in correct proportion but at wrong heights (unless rescaled in which case full marks are available) (eg heights of 0.6, 1, 1, 1.8, 0.7)