
4MA0 Higher January 2015 Paper 4R Q18
18
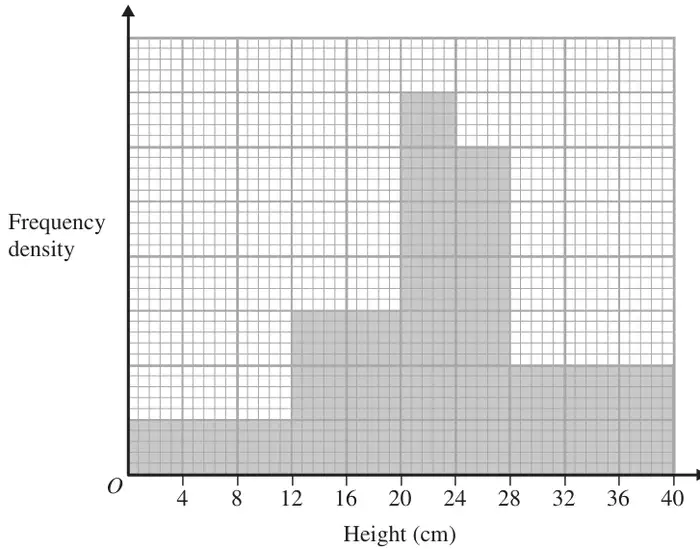
The histogram gives information about the heights of some plants.
There are 360 plants with a height of 20 cm or less.
Work out the number of plants with a height of more than 20 cm.
(3)
| Scheme | Marks |
|---|---|
| 360 ÷ 9 = 40 (per cm sq) or 360 ÷ (9 × 25) =1.6 | M1 |
| “40” × 19 oe or 7ד40” + 6 × “40” + 6ד40” or 280 + 240 + 240 or 19 × 25 × “1.6” | M1 |
| 760 | A1 |
| (3 marks) |
Notes
M1: dep
Alternative method
| Scheme | Marks |
|---|---|
| \(2a \times 12 + 6a \times 8 = 360\) | M1 |
\(a = \dfrac{360}{72} = 5\) and 14ב5’×4 + 12ב5’×4 + 4ב5’×12 | M1 |
| 760 | A1 |
Notes
M1: dep