
4MA0 Higher January 2015 Paper 4 Q20
20 The histogram shows information about the heights of some tomato plants.
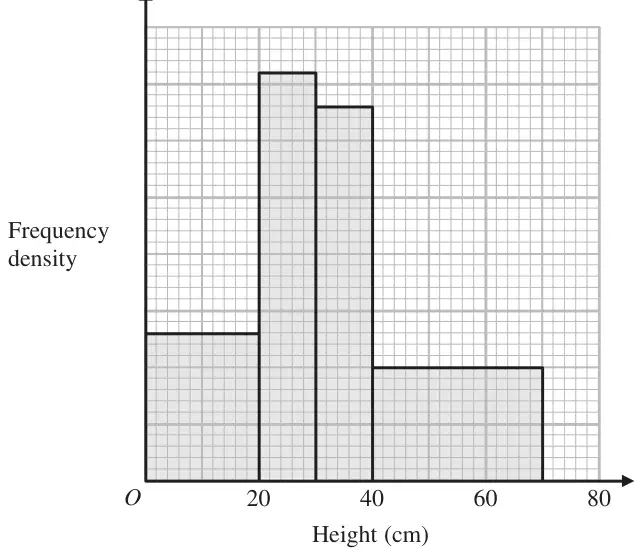
26 plants have a height of less than 20 cm.
Work out the total number of tomato plants.
(3)
| Scheme | Marks |
|---|---|
26 ÷ 20 (=1.3) or 3.6×10 or 3.3×10 or 1×30 or 36 or 33 or 30 or \(\dfrac{26}{130}\left(= \dfrac{1}{5}\right)\) | M1 |
26 + 3.6×10 + 3.3×10 + 1×30 or 26 + 36 + 33 + 30 or \(625 \times \dfrac{1}{5}\) or \((130 + 180 + 165 + 150) \times \dfrac{1}{5}\) | M1 |
| 125 | A1 |
| (3 marks) |
Notes
M1: Any one frequency density (without contradiction) or,
eg. 1cm2 = 5 or
clear association of area with frequency
M1: Any fully correct complete method;
condone one error in bar width or bar height