
4MA0 Foundation January 2014 Paper 2R Q5
5
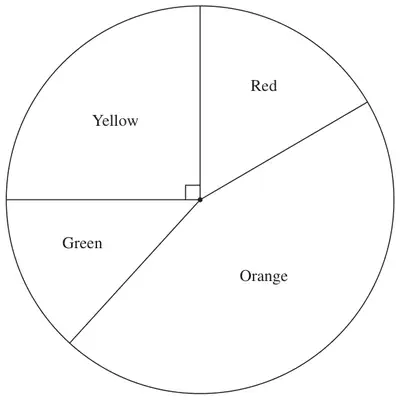
A jar contains 60 sweets.
The sweets are red or orange or green or yellow.
The number of sweets of each colour in the jar was used to draw the pie chart.
The pie chart is accurately drawn.
(a) Which colour sweet is there most of in the jar? (1)
(b) Measure the size of the angle on the pie chart for green sweets. (1)
The angle on the pie chart for yellow sweets is \(90^\circ\)
(c) How many of the 60 sweets in the jar are yellow? (2)
10 of the 60 sweets in the jar are red.
Billy takes at random a sweet from the jar.
(d) What is the probability that he takes a red sweet? (1)
| Scheme | Marks |
|---|---|
| Orange | B1 |
| (1) |
| Scheme | Marks |
|---|---|
| 47 | B1 |
| (1) |
Notes
B1: Allow 45 to 49 inclusive.
| Scheme | Marks |
|---|---|
| \(\dfrac{90}{360} \times 60\) or \(\dfrac{1}{4} \times 60\) or \(60 \div 4\) or \(90 \div 6\) | M1 |
| 15 | A1 |
| (2) |
Notes
M1: for \(\dfrac{90}{360}\) or \(\dfrac{1}{4}\)
| Scheme | Marks |
|---|---|
| \(\dfrac{10}{60}\) oe \(\dfrac{1}{6}\) | B1 |
| (1) | |
| (Total 5 marks) |
Notes
B1: Allow decimal values which round or truncate to 0.16 or 0.17