
1MA0 Higher June 2015 Paper 2 Q26
26 The histogram shows some information about the salaries of a sample of people.
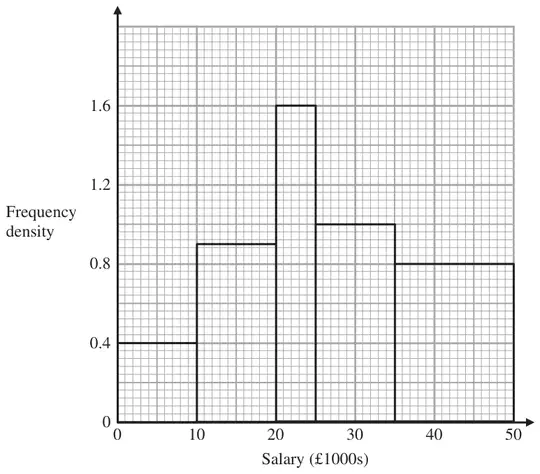
(a) Use the histogram to complete the frequency table.
(2)
| Salary (\(p\)) in £1000s | Frequency |
|---|---|
| \(0 \lt p \leqslant 10\) | 4 |
| \(10 \lt p \leqslant 20\) | |
| \(20 \lt p \leqslant 25\) | |
| \(25 \lt p \leqslant 35\) | |
| \(35 \lt p \leqslant 50\) |
(b) Work out the proportion of people in the sample who have a salary greater than £40 000 (2)
(c) Find an estimate for the median salary. (2)
| Answer | Mark | Notes |
|---|---|---|
| (4), 9, 8, 10, 12 | 2 | M1 for correct calculation to find one frequency e.g. \(0.9 \times 10\) or \(1.6 \times 5\) or \(1 \times 10\) or \(0.8 \times 15\) or for one frequency correct or shows that 1 cm\(^2\) = 1 A1 for all frequencies correct |
| Answer | Mark | Notes |
|---|---|---|
| \(\dfrac{8}{43}\) | 2 | M1 for 8 (people) or \(\tfrac{2}{3}\) of “12” A1ft for 8 out of 43 stated as a percentage or fraction or decimal |
| Answer | Mark | Notes |
|---|---|---|
| 26000 | 2 | M1 ft for finding the interval in which the “21.5th” or “22nd” value lies or 26 or 25.5 A1 for 26000 or 25500 |