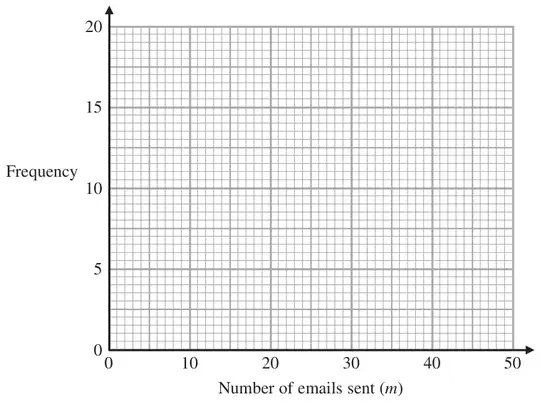
9 The frequency table gives information about the numbers of emails sent by 51 teachers on Monday.
Number of emails sent (\(m\))
Frequency
\(0 \lt m \leqslant 10\)
5
\(10 \lt m \leqslant 20\)
17
\(20 \lt m \leqslant 30\)
14
\(30 \lt m \leqslant 40\)
9
\(40 \lt m \leqslant 50\)
6
(a) On the grid below, draw a frequency polygon for this information.(2)
*(b) Nalini says that at least a quarter of these teachers sent more than 30 emails. Is Nalini correct? You must explain your answer. (2)
Mark scheme (a)
Answer
Mark
Notes
Polygon drawn
2
B2 for correct plotting of 5 points and joining with line segments (B1 for points plotted correctly at midpoints of intervals OR joining points with line segments at the correct heights and consistent within the class interval (including end values) OR correct frequency polygon with one point incorrect OR correct frequency polygon with first and last point joined) NB Ignore any histogram drawn and any part of frequency polygon outside range of first and last points plotted
Mark scheme (b)
Answer
Mark
Notes
Yes with reason
2
M1 for finding a quarter of 51 and for finding how many teachers sent more than 30 emails C1 for 12.75 or 13 compared to 15 and yes she is correct
OR M1 for finding how many teachers sent more than 30 emails and ‘15’ × 4 C1 for comparing 60 with 51 and yes she is correct
OR M1 for \(15 \div 51\) (= 0.29...) or \(\dfrac{15}{51} \times 100\) (= 29…%) C1 for comparing 0.29.. with \(\dfrac{1}{4}\) or 0.25 OR 29….% with 25% and yes she is correct