
1MA0 Higher June 2015 Paper 1 Q6
6 The scatter graph shows information about the age and the price of each of 12 cars of the same model.
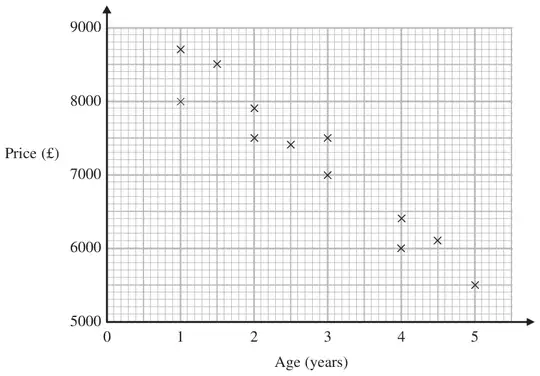
(a) Describe the relationship between the age of a car and its price. (1)
A different car of the same model is \(3\tfrac{1}{2}\) years old.
(b) Estimate the price of this car. (2)
| Answer | Mark | Notes |
|---|---|---|
| Relationship | 1 | B1 for a description of a dynamic relationship eg “The older the car the lower the price” or “The newer the car the greater the price” oe (accept negative correlation) |
| Answer | Mark | Notes |
|---|---|---|
| 6400 to 7000 | 2 | M1 for a single straight line segment with negative gradient that could be used as a line of best fit or vert. line from 3.5 or a point plotted at \((3.5, y)\), where \(y\) is in the range 6400 to 7000 A1 for 6400 - 7000 |