
1MA0 Higher November 2015 Paper 2 Q10
10 A coach travels from Dronston to Luscoe.
The travel graph for this journey is shown below.
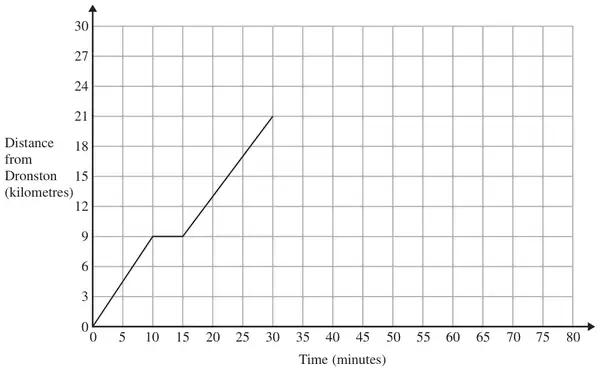
(a) Work out the average speed of the coach, in kilometres per hour, for the first 10 minutes of the journey. (2)
The coach stops in Luscoe for 15 minutes.
The coach then returns to Dronston at a constant speed of 42 km/h.
(b) Show this information on the travel graph. (3)
| Working | Answer | Mark | Notes |
|---|---|---|---|
| \(9 \times 6\) | 54 | 2 | M1 for a method to find the speed e.g \(9 \div 10\), \(9 \div 0.16\) A1 cao |
| Answer | Mark | Notes |
|---|---|---|
| Graph completed | 3 | B1 horizontal line from (30,21) to (45,21) M1 for a complete method to show the return journey is 30 mins or \(\tfrac{1}{2}\) hour evidenced by the line on the graph or by calculation A1 Correct line drawn from Luscoe \((x, 21)\) to \((x + 30, 0)\) |