
1MA0 Foundation June 2016 Paper 2 Q6
6 The graph gives information about the number of litres of petrol in the tank of Jim’s car during a journey.
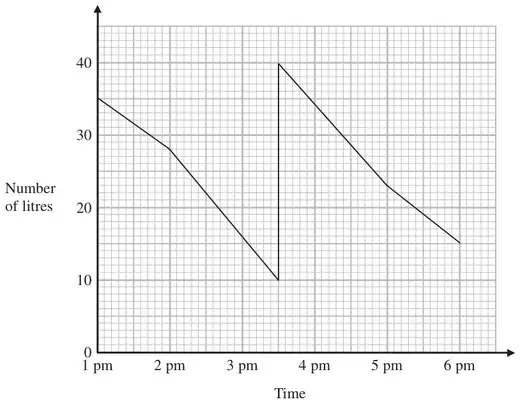
(a) How many litres of petrol were in the tank at 1 pm? (1)
At 3 30 pm Jim stopped and put some petrol into the tank.
(b) How many litres of petrol did Jim put into the tank? (1)
(c) Work out the total number of litres of petrol the car used between 1 pm and 6 pm. (2)
| Answer | Mark | Notes |
|---|---|---|
| 35 | 1 | B1 cao |
| Answer | Mark | Notes |
|---|---|---|
| 30 | 1 | B1 cao |
| Answer | Mark | Notes |
|---|---|---|
| 50 | 2 | M1 for \(35 - 10\) (= 25) or \(40 - 15\) (= 25) or \(35 + \text{``}30\text{''} - 15\) oe A1 for 50 or f.t. from (b) + 20 |