
1MA0 Foundation June 2017 Paper 1 Q15
15
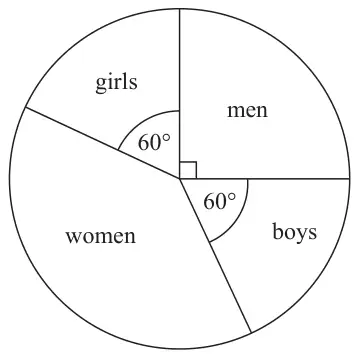
Diagram NOT accurately drawn
The pie chart above gives information about the people who went to a shop last week.
(a) What fraction of the people were girls?
Give your answer in its simplest form. (2)
Give your answer in its simplest form. (2)
30 boys went to the shop.
(b) Work out the number of women who went to the shop. (3)
The pie chart below gives information about the people who went to the same shop this week.
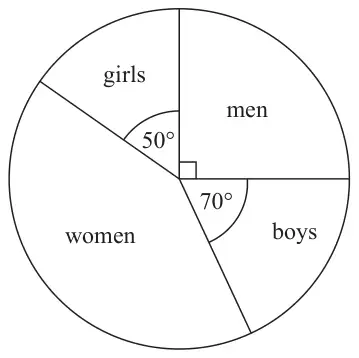
Diagram NOT accurately drawn
Laurent says,
“The pie chart shows that more boys went to the shop this week than last week.”
(c) Is Laurent correct?
Explain your answer. (1)
Explain your answer. (1)
| Answer | Mark | Notes |
|---|---|---|
| \(\frac{1}{6}\) | 2 | B2 cao (B1 for any equivalent fraction) |
| Answer | Mark | Notes |
|---|---|---|
| 75 | 3 | M1 for method to work out degree equivalent of 1 person e.g. \(60 \div 30\) (= 2) M1 for a complete method to work out number of women e.g. \((360 - 60 - 60 - 90) \div \text{``}2\text{''}\) oe A1 cao or M1 for complete method to work out angle of women sector eg \(360 - 60 - 60 - 90\) (= 150) M1 for a complete method to work out number of women e.g. \((\text{``}150\text{''} \div 60) \times 30\) oe A1 cao |
| Answer | Mark | Notes |
|---|---|---|
| Can’t tell or No (supported) | 1 | B1 for a convincing reason e.g. there is no information about the population size this week |