
1MA0 Foundation November 2014 Paper 2 Q21
21 The scatter graph shows some information about ten pine cones from the same tree.
It shows the length and the width of each pine cone.
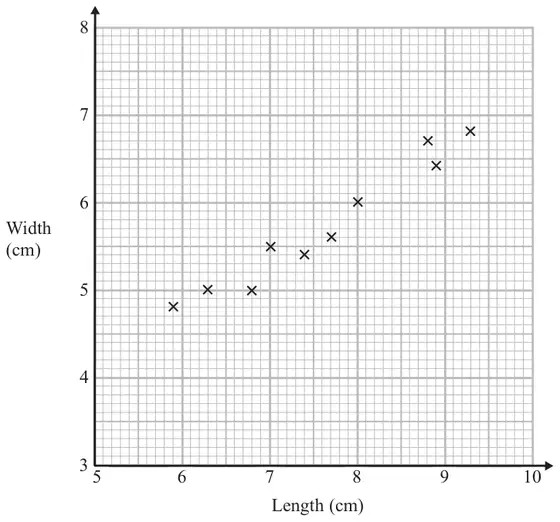
(a) Describe the relationship between the length and the width of a pine cone. (1)
Another pine cone from this tree has a length of 8.4 cm.
(b) Estimate the width of this pine cone. (2)
| Answer | Mark | Notes |
|---|---|---|
| Relationship | 1 | B1 for description of relationship eg “As the length of the pine cone increases the width increases” oe (accept positive correlation) |
| Answer | Mark | Notes |
|---|---|---|
| 6.1 to 6.4 | 2 | M1 for a single straight line segment with positive gradient that could be used as a line of best fit or a vertical line from 8.4 or a point at (8.4, \(y\)) where \(y\) is from 6.1 to 6.4 A1 for given answer in the range 6.1 to 6.4 |