
1MA0 Foundation June 2015 Paper 2 Q11
11 The graph shows the number of adults and the number of children going to a museum each month from January to April.
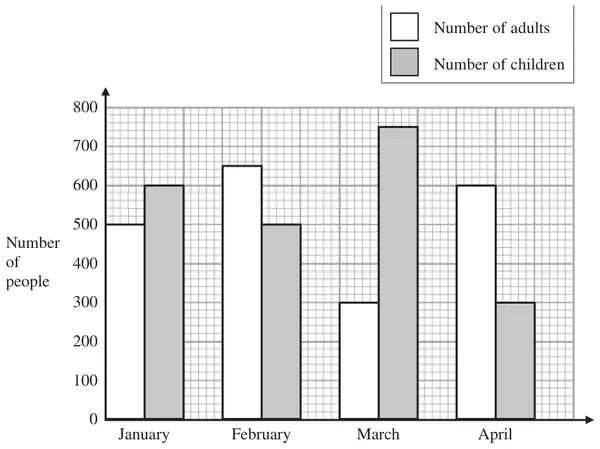
(a) How many adults went to the museum in March? (1)
More children than adults went to the museum in the 4 months from January to April.
(b) Work out how many more. (3)
| Answer | Mark | Notes |
|---|---|---|
| 300 | 1 | B1 cao |
| Answer | Mark | Notes |
|---|---|---|
| 100 | 3 | M1 for intention to find the total number of adults or the total number of children M1(dep) for subtracting the two totals A1 for answer in range 90 to 110 OR M1 for intention to find the difference between the number of adults and the number of children for two months M1 (dep) for correctly processing all the differences A1 for answer in range 90 to 110 |