
1MA0 Foundation November 2015 Paper 2 Q22
22 A delivery driver records for each delivery the distance he drives and the time taken.
The scatter graph shows this information.
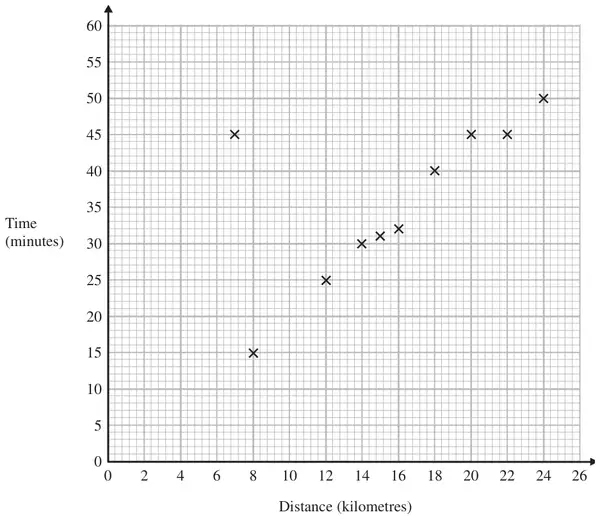
For another delivery he drives 22 kilometres and takes 50 minutes.
(a) Show this information on the scatter graph. (1)
(b) What type of correlation does the scatter graph show? (1)
The driver has to drive a distance of 10 km for his next delivery.
(c) Estimate the time taken for this delivery. (2)
During one of the deliveries, the driver was delayed by road works.
(d) Using the graph write down the time taken for this delivery. (1)
| Answer | Mark | Notes |
|---|---|---|
| Point plotted | 1 | B1 cao |
| Answer | Mark | Notes |
|---|---|---|
| positive | 1 | B1 cao |
| Answer | Mark | Notes |
|---|---|---|
| 18 – 22 | 2 | M1 for a single line segment with positive gradient that could be used as a line of best fit or a vertical line from 10 or a point plotted at (10, \(y\)) where \(y\) is in the range 18 – 22 A1 18 – 22 |
| Answer | Mark | Notes |
|---|---|---|
| 45 | 1 | B1 cao |