
1MA0 Higher June 2016 Paper 2 Q16
16 The cumulative frequency graph shows information about the weights of 60 apples.
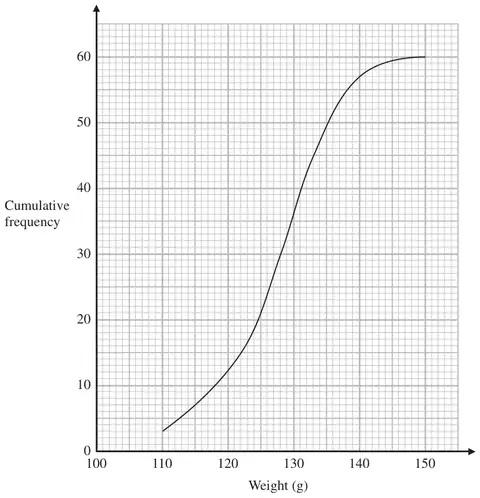
(a) Use the graph to find an estimate for the median weight. (1)
(b) Use the graph to find an estimate for the interquartile range of the weights. (2)
| Answer | Mark | Notes |
|---|---|---|
| 128 | 1 | B1 for answer in the range 128 to 128.5 |
| Answer | Mark | Notes |
|---|---|---|
| 10.5 to 11.5 | 2 | M1 for a LQ in the range 122 to 122.5 or an UQ in the range 133 to 133.5 A1 for answer in the range 10.5 to 11.5 |